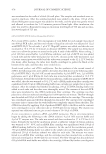
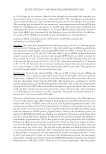
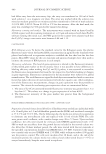
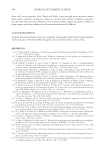
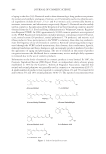
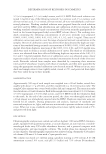
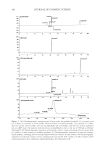
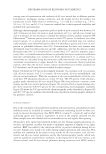
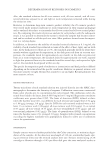
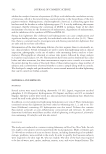
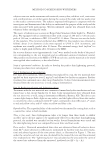
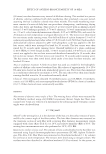
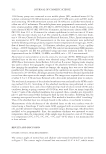
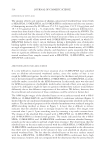
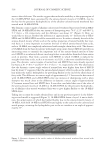
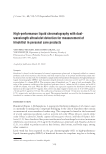
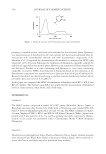
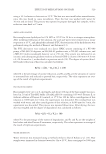
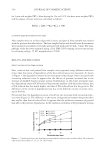
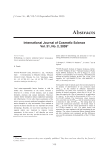
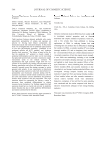
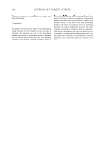
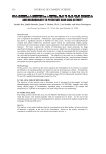
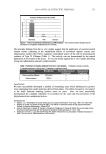
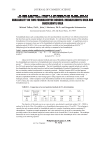
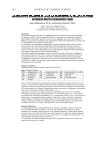
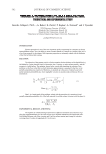
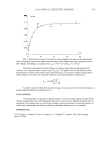
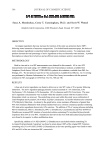
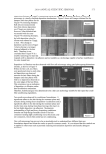
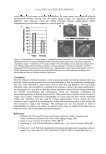
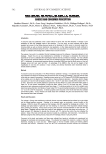
MEASUREMENT OF HINOKITIOL BY HPLC 521 UV ABSORPTION SPECTRUM The UV absorption spectrum of hinokitiol was obtained with a UV-1200 spectropho- tometer (Shimadzu). Hinokitiol (5 μg/ml) was dissolved in the mobile phase for HPLC analysis using RP-4 as described below, and the spectrum was determined in the range of 200 to 400 nm. PROCEDURES RP-HPLC procedure. The mobile phases for HPLC analysis using RP-4, RP-8, and RP-18 con- sisted of acetonitrile:water:trifl uoroacetic acid (300:700:0.5, 450:550:0.5, and 500:500:0.5, respectively, v/v/v). The samples were eluted from the column at a fl ow rate of 1.0 ml/min at room temperature. Preparation of standard solutions. A stock solution of hinokitiol (160 μg/ml) in 50% ethanol was prepared and diluted with water as required. It was stored in a dark glass bottle at 4°C. The working concentrations of hinokitiol were set at 0, 0.05, 0.1, 0.2, 0.5, 1, 2, and 5 μg/ml. Aliquots of 200 μl were injected into the HPLC column. Sample preparation. The tested hair restorer (0.50 ml), skin lotion (10 ml), and body soap (0.10 g) were each diluted to 100 ml with water, and aliquots (200 μl) were directly in- jected into the column. Recovery. The known amounts of hinokitiol (0.250 mg, 80.0 μg, and 16.0 μg) were added to the hair restorer (0.50 ml), skin lotion (10 ml), and body soap (0.10 g), respec- tively, and were diluted as the same manner. Aliquots (200 μl) were analyzed and hi- nokitiol levels were determined in each sample. The recovery value was calculated as follows. RESULTS AND DISCUSSION UV ABSORPTION SPECTRUM The UV absorption spectrum of hinokitiol (Figure 1) showed absorption maxima at around 240 and 345 nm. Therefore, hinokitiol was monitored at 240 and 345 nm to maximize the sensitivity. CHROMATOGRAMS Figure 2 shows typical chromatograms of hinokitiol (1 μg/ml) using RP-18, RP-8, and RP-4 columns. The retention times were 5.0, 6.2, and 7.1 min, respectively, at both wavelengths. The symmetry coeffi cients at 240 nm and 345 nm were 3.1 and 3.7 for RP-18, 1.9 and 1.7 for RP-8, and 1.3 and 1.3 for RP-4, respectively. Recovery value = (Measured amount after addition) (Known ammount) - (Measured amount before addition) ´ 100

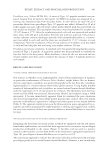
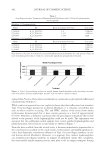
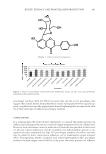
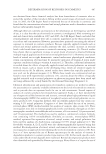
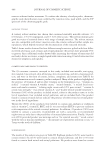
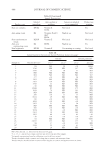
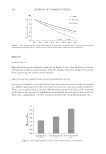
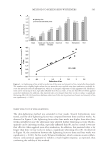
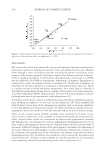
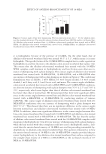
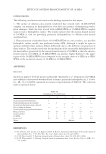
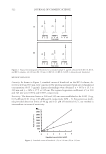
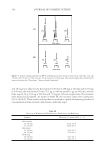
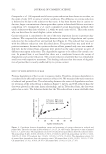
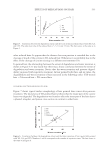
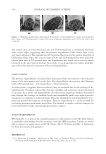
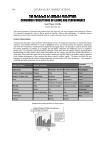
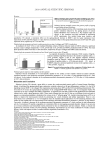
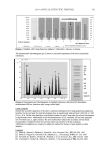
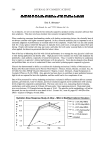
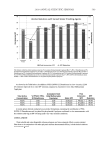
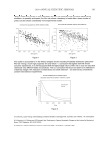
JOURNAL OF COSMETIC SCIENCE 522 METHOD VALIDATION Linearity. As shown in Figure 3, standard curves of hinokitiol on the RP-4 column, de- tected at 240 and 345 nm, were constructed by plotting integrated peak area vs hinokitiol concentration (0.05–5 μg/ml). Linear relationships were obtained: y = 667x + 15.3 at 240 nm and y = 265x + 17.5 at 345 nm. The squared regression coeffi cients (r2) at 240 and 345 nm were 0.9974 and 0.9933, respectively. Sensitivity. The detection limits at 240 and 345 nm were established to be 0.005 (1 ng, 0.03 μM) and 0.01 (2 ng, 0.06 μM) μg/ml, respectively (S/N = 3). Since previous meth- ods provided detection limits of 40 pg and 0.21 μM of hinokitiol (6,7), our method is intermediate in terms of sensitivity. Figure 2. Typical chromatograms of hinokitiol in a standard sample (1 μg/ml), obtained with RP-18, RP-8, and RP-4 columns. (A) 240 nm (B) 345 nm. (1) RP-18 (2) RP-8 (3) RP-4. Arrowed peak: hinokitiol. Figure 3. Standard curves of hinokitiol. (○) at 240 nm. ( ) at 345 nm.
Purchased for the exclusive use of nofirst nolast (unknown)
From: SCC Media Library & Resource Center (library.scconline.org)