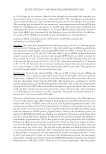
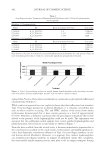
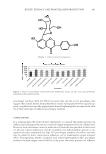
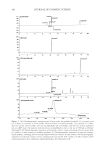
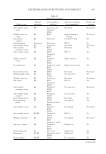
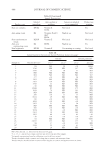
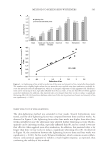
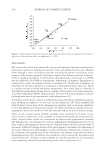
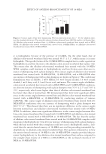
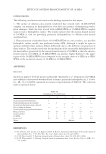
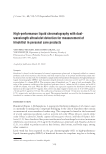
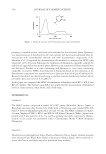
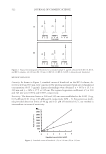
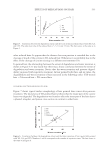
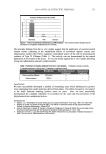
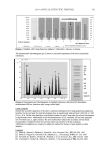
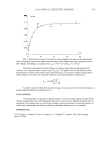
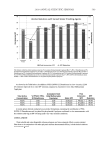
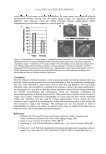
MEASUREMENT OF HINOKITIOL BY HPLC 523 PRECISION AND ACCURACY Precision and accuracy for intra- and interday assays are shown in Tables I and II. In the intraday assay (Table I), the ranges of standard deviation (S.D.) from the average (C.V.) of hinokitiol at 240 and 345 nm were within the ranges of 4.1–5.8% and 3.8–6.8%, respec- tively. The recoveries were in the range of 99.4–103.0%. In the interday assay (Table II), the corresponding values were within the ranges of 4.4–8.2% and 4.7–8.7%, respec- tively, and the recoveries were in the range of 96.6–104.4%. APPLICATION TO THREE PERSONAL CARE PRODUCTS The hinokitiol levels in the skin lotion and body soap used in this study were not speci- fi ed, while the label concentration for the hair restorer was 0.5 mg/ml. Each product was examined six times with our newly developed method. Typical chromatograms are shown in Figure 4. For the hair restorer, the average values of hinokitiol level with detection at 240 nm and 345 nm were 0.536 mg/ml (C.V. = 4.1%, recovery = 107.2%) and 0.502 mg/ml (C.V. = 3.9%, recovery = 100.4%), respectively. Recovery was satisfactory. The corresponding results were 7.81 μg/ml (C.V. = 6.7%) and 8.02 μg/ml (C.V. = 6.8%) for the skin lotion and 0.182 mg/g (C.V. = 7.2%) and 0.178 mg/g (C.V. = 7.4%) for the body soap, respectively. In addition, recovery values of diluted samples spiked with a known amount of hinokitiol were examined at 240 and 345 nm. The known amount of hinokitiol (0.250 mg, 80.0 μg, Table I Intraday Assay Reproducibility for Determination of Hinokitiol Concentration (μg/ml) Measured (μg/ml) (mean ± S.D., n = 5) C.V. (%) Recovery (%) 240 nm 0.05 0.0497 ± 0.0029 5.8 99.4 0.5 0.509 ± 0.027 5.3 101.8 5 5.12 ± 0.21 4.1 102.4 345 nm 0.05 0.0515 ± 0.0035 6.8 103.0 0.5 0.508 ± 0.024 4.7 101.6 5 5.06 ± 0.19 3.8 101.2 Table II Interday Assay Reproducibility for Determination of Hinokitiol Concentration (μg/ml) Measured (μg/ml) (mean ± S.D., n = 5) C.V. (%) Recovery (%) 240 nm 0.05 0.0494 ± 0.0033 6.7 98.8 0.5 0.514 ± 0.042 8.2 102.8 5 5.22 ± 0.23 4.4 104.4 345 nm 0.05 0.0520 ± 0.0045 8.7 104.0 0.5 0.483 ± 0.037 7.7 96.6 5 5.14 ± 0.24 4.7 102.8

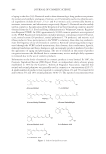
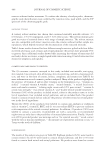
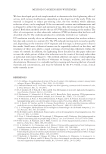
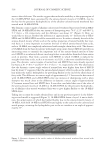
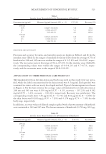
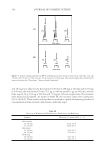
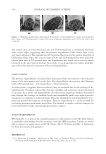
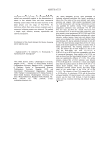
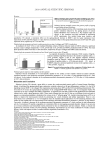
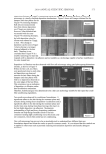
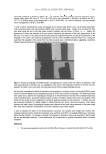
JOURNAL OF COSMETIC SCIENCE 524 Figure 4. Typical chromatograms (on RP-4) of hinokitiol in hair restorer, skin lotion, and body soap. (A) 240 nm (B) 345 nm. (1) Hair restorer (2) skin lotion (3) body soap. The tested samples were diluted with water as described in “Procedures.” Arrowed peak: hinokitiol. and 16.0 μg) was added to the hair restorer (0.50 ml 0.268 mg at 240 nm and 0.251 mg at 345 nm), the skin lotion (10 ml 78.1 μg at 240 nm and 80.2 μg at 345 nm), and the body soap (0.10 g 18.2 μg at 240 nm and 17.8 μg at 345 nm), respectively. The mixtures were diluted and analyzed. As shown in Table III, the recovery values were satisfactory (92.4–104.8%). These results indicate that our method is capable of measuring hinokitiol concentration in hair restorers, skin lotions, and body soaps. Table III Recovery of Hinokitiol in Hair Restorer, Skin Lotion, and Body Soap Samples Recovery (%, mean ± S.D., n = 5) Hair restorer At 240 nm 102.2 ± 6.8 At 345 nm 104.8 ± 6.6 Skin lotion At 240 nm 96.4 ± 6.3 At 345 nm 95.0 ± 6.2 Body Soap At 240 nm 92.4 ± 5.3 At 345 nm 94.6 ± 5.5
Purchased for the exclusive use of nofirst nolast (unknown)
From: SCC Media Library & Resource Center (library.scconline.org)