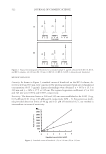
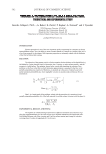
JOURNAL OF COSMETIC SCIENCE 480 had fallen away from the microarray chip, the array was transferred to 300 ml of fresh wash solution 1 on a magnetic stir plate. The array was washed while the solution was mixed at medium speed for ten minutes and then transferred to 300 ml of wash solution 2 (0.1X SSX, 0.005% Triton X-102) at 4°C for fi ve minutes. After the fi nal wash, the array was centrifuged at 500 rpm for fi ve minutes for drying. Microarray scanning and analysis. The microarrays were scanned with an Axon GenePix 4100A scanner with the scanning resolution set at 10 μm and analyzed with GenePix Pro software. During the initial scan, the PMT gains for the scanner were adjusted such that the Cy5/Cy3 image count ratios were between 0.88 and 1.12. CALCULATIONS RNA Ribogreen assay. To derive the standard curve for the Ribogreen assay, the relative fl uorescent units versus the known RNA concentrations in μg/ml for the standards were plotted and subjected to regression analysis to establish the line that best fi ts the data points. Mean RFU values for the test materials and untreated samples were then used to estimate the amount of RNA present in each sample. Microarray calculations. The level of gene expression is related to the fl uorescent intensity of the probed gene marker on the microarray. Since it was possible to have differences in labeling effi ciency when making the Cy3 and Cy5 probes, it was essential to normalize the fl uorescence measurements between the two respective dyes before looking at changes in gene expression. Fluorescence intensities for the microarrays were subjected to global normalization. The total fl uorescent signal for both dyes was normalized with a correction factor that makes the ratio of total intensities for both dyes equal to one. After normaliza- tion of the fl uorescence measurements, changes in gene expression were then possible to examine. The criteria for evaluating gene expression values are summarized below: 1. The ratio of Cy3/Cy5 (untreated/treated) fl uorescence intensity was greater than 1.3 or less than 0.7. This relates to a change in gene expression of at least ±30%. 2. The fl uorescent intensity of the gene marker was greater than the background intensity. HUMAN DERMAL FIBROBLAST PROCOLLAGEN (TYPE 1 C-PEPTIDE) ASSAY Preparation of normal human dermal fi broblasts. Fibroblasts were seeded into individual wells of a 12-well plate in 1.0 ml of fi broblast growth media (FGM) and incubated overnight at 37 ± 2°C and 5 ± 1% CO2. On the following day, the media was removed via aspiration to eliminate any non-adherent cells and replaced with 1.0 ml of fresh FGM. The cells were grown until confl uent, with a media change every 48 to 72 hours. Upon reaching confl uence, the cells were treated for 24 hours with DMEM supplemented with 1.5% FBS to wash out any effects from the growth factors included in the normal culture me- dia. After this 24-hour washout period, the cells were treated with the test materials at the specifi ed concentrations dissolved in DMEM with 1.5% FBS. Untreated cells (nega- tive controls) only received DMEM with 1.5% FBS, while sodium ascorbate (100 μg/ml) was the positive control. The cells were incubated for 48 hours, and at the end of the incubation period, the culture media was collected and either stored frozen (−75°C) or assayed immediately. Samples were tested in triplicate.

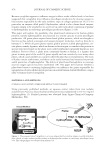
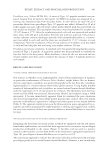
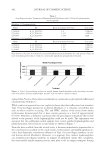
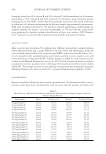
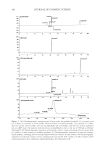
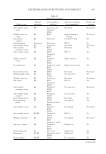
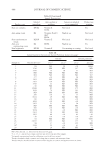
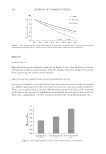
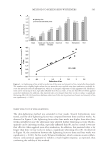
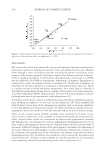
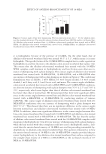
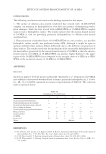
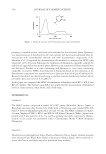
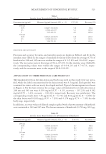
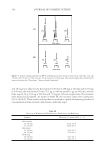
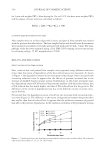
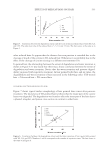
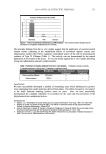
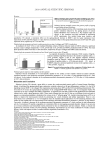
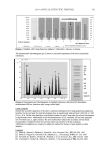
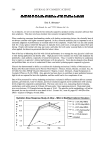
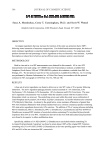
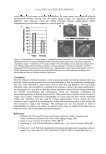
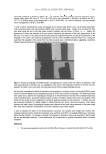
KUDZU EXTRACT AND PROCOLLAGEN PRODUCTION 481 Procollagen assay (Takara ELISA Kit). A series of Type 1 C-peptide standards was pre- pared, ranging from 40 ng/ml to 640 ng/ml. An ELISA microplate was prepared by re- moving any unneeded strips from the plate frame. In each well to be used 100 μl of peroxidase-labeled anti-procollagen Type 1 C-peptide was added, followed by 20 μl of either sample (one part collected tissue culture media diluted with four parts fresh cul- ture media) or standard. The microplate was then covered and allowed to incubate for 3 ± 0.25 hours at 37°C. After the incubation period, each well was aspirated and washed three times with 400 μl of wash buffer. After the last wash was removed, 100 μl of per- oxidase substrate solution (hydrogen peroxide with tetramethylbenzidine as a chroma- gen) was added to each well and the plate was incubated for 15 ± 5 minutes at room temperature. After the incubation, 100 μl of stop solution (1 N sulfuric acid) was added to each well and the plate was read using a microplate reader at 450 nm. Procollagen concentration calculations. A standard curve was generated using known concen- trations of Type 1 C-peptide. A regression analysis was then performed to establish the line that best fi t the data points. Mean absorbance values for the test materials and un- treated samples were then used to estimate the amount of Type 1 C-peptide present in each sample. RESULTS AND DISCUSSION HUMAN DERMAL FIBROBLAST MICROARRAY RESULTS Our interest in whether or not leghemoglobin, derived from symbiosomes of legumes, in particular symbiosomes of Pueraria lobata (kudzu), might behave like its human- derived counterpart, cytoglobin, was spurred principally by the fact that, like cytoglobin, leghemoglobin is a hexacoordinate heme-based globin protein. Using highly purifi ed samples of leghemoglobin and cytoglobin, we treated normal human dermal fi broblasts with the equivalent of 1% of each protein for 24 hours. The fi broblasts were then har- vested and the RNA was retrieved, fl uorescently labeled, and analyzed using a DNA microarray. It became immediately apparent when we examined the gene expression data for several important extracellular matrix proteins that, indeed, these two similar proteins could infl uence expression of collagen and elastin genes in very similar fashions (Table I). The apparent similarity between the fi brous protein genes upregulated by cy- toglobin and those upregulated by leghemoglobin is striking and suggests that, indeed, the very close similarity of these two proteins infl uences dermal fi broblasts in very simi- lar ways. PROCOLLAGEN ASSAY RESULTS ON HUMAN DERMAL FIBROBLASTS Examining the data from our initial studies in which we employed only the raw extract from kudzu symbiosomes, we noted that there appeared to be an increase in procollagen production attributable to the extract (Figure 2). Ascorbic acid was used as a positive control in these studies, as it has been shown in the literature to upregulate expression of Type 1A1 procollagen in human fi broblasts in vitro and in vivo (19). This initial assay appeared to indicate that the extract of kudzu symbiosomes did stimulate procollagen production in normal human dermal fi broblasts. However, it was immediately
Purchased for the exclusive use of nofirst nolast (unknown)
From: SCC Media Library & Resource Center (library.scconline.org)