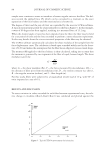
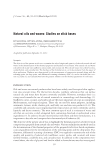
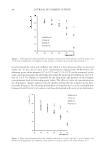
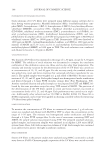
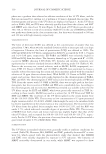
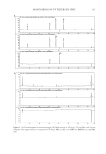
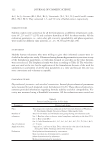
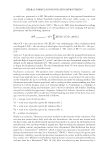
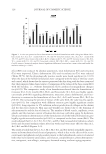
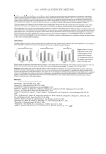
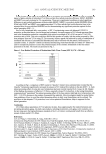
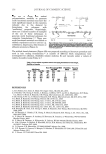
JOURNAL OF COSMETIC SCIENCE 98 Carnauba and candelilla waxes in concentrations varying between 0 and 5 w/w% were present in the selected compositions, along with yellow beeswax (Figures 4–6). Upon observing the impact of waxes on the softening point, it can be concluded that signifi cant changes were detected only in the case of carnauba wax. For carnauba wax-free samples, the softening point is 59.8 ± 0.3°C, while for compositions containing 5 w/w% carnauba wax 71.0 ± 0.0°C is measured. It can be seen that the maximum effect on the softening point can be reached with 3 w/w% carnauba wax content, whereas higher concentrations (4–5 w/w%) do not cause any more change in the softening points. In the case of candel- illa wax, the presence and the amount of wax (in a concentration range of 0–5 w/w%) did not seem to infl uence the softening point (Figure 4). Similarly, the presence of candelilla wax did not seem to have a signifi cant effect on the drop point values of compositions containing 0–5 w/w% wax. In the case of carnauba wax, however, the increasing amounts of wax resulted in higher drop point values, varying between 56.0 ± 0.5°C and 70.0 ± 1.0°C (Figure 5). Also of note, a plateau effect on the drop point can be detected, with a Figure 5. Drop points determined for wax samples composed of 5 w/w% glycerol, 5 w/w% lanolin, 60 w/w% sunfl ower oil, and 0–5 w/w% appropriate wax (carnauba or candelilla) the rest was yellow beeswax. n=3. Figure 6. Compression strengths determined for wax samples composed of 5 w/w% glycerol, 5 w/w% lano- lin, 60 w/w% sunfl ower oil, and 0–5 w/w% appropriate wax (carnauba or candelilla) the rest was yellow beeswax. n=3.

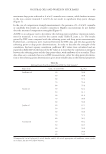
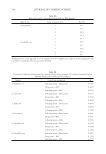
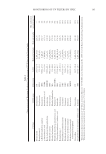
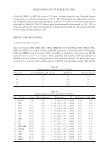
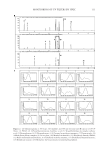
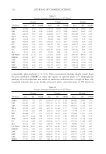
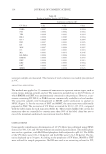
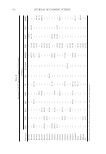
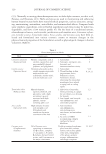
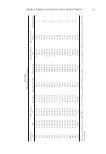
NATURAL OILS AND WAXES IN STICK BASES 99 maximum drop point achieved at 4 w/w% carnauba wax content, while further increases in the wax content (towards 5 w/w%) do not result in signifi cant drop point changes (Figure 5). In the case of compression strength measurements, the presence of 1–2 w/w% carnauba or candelilla wax results in a harder consistency. Higher concentrations do not further alter the measured compression strengths (Figure 6). As DSC is an adequate tool to determine the melting point and phase transition param- eters for materials, it was used for the current study (Table II, parts a, b). The results gained by DSC were compared with the softening point and drop point measurements. Furthermore, correlations were examined between the DSC data and the data gained by softening point or drop point determinations. In order to describe the strength of the correlation, the least squares correlation coeffi cient (R2) values were calculated and are reported in Table III. On the basis of the R2 values it is clear that the correlation is strongest between the softening point and the drop point values, with sunfl ower oil as an outlier. These data allow us to conclude that next to DSC measurements, either the drop point determina- tion or the softening point determination gives more reliable data on the thermal properties Table IIa Melting Points (Tm) Determined with DSC for Oily Samples* Type of oil Conc. of oil (w/w%) Tm (°C) Sunfl ower oil 40 59.8 50 58.8 60 57.2 70 55.6 80 55.4 Castor oil 40 62.2 50 61.1 60 61.0 70 58.6 80 58.8 Jojoba oil 40 62.1 50 59.5 60 58.8 70 57.3 80 56.3 Coconut oil 40 60.2 50 60.3 60 59.9 70 58.0 80 54.5 *Composed of 5 w/w% glycerol, 5 w/w% lanolin, and 40–80 w/w% appropriate oil (sunfl ower, castor, jojoba, or coconut) the rest was yellow beeswax.
Purchased for the exclusive use of nofirst nolast (unknown)
From: SCC Media Library & Resource Center (library.scconline.org)