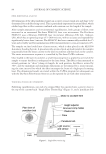
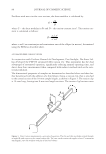
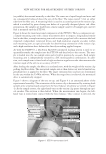
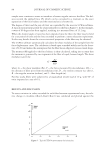
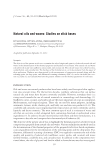
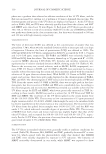
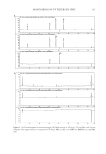
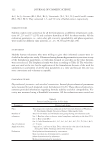
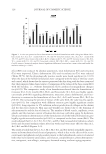
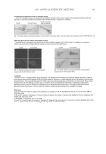
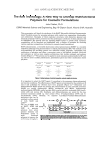
JOURNAL OF COSMETIC SCIENCE 88 sample arms continue to rotate to introduce a known angular twist to the fi ber. The bal- ance records the applied force (F), which can be converted to a moment, as the exact separation of the force balance and the rotational axis is known (L). The degree of twist and the rate of twist are controlled by the user via UvWin software. A typical measurement profi le for a hair/nylon fi ber is shown in Figure 5. In this example, a twist of 90 degrees has been applied, resulting in a measured force of 13.2 mg. When the desired angle of twist has been imparted into the fi ber, the fi ber may be held for a set period of time and the force recorded to perform a stress relaxation experiment. In this way, details about the viscous torsional properties of the fi ber may be obtained. The UvWin software automatically calculates the shear modulus of the sample from the force-displacement curve. The calculation is based upon a method widely used in the litera- ture (29,30) and makes the assumption that the fi ber has an elliptical cross-sectional shape. The moment (M) applied to the force balance is then calculated, taking into account that the moment is generated by two segments of the fi ber of equal, known length. The shear modulus is given by: Frl G D T where G = the shear modulus (Pa), F = the force measured by microbalance (N), r = the distance of fi ber pivot from microbalance (m), D = the torsion constant (see above), θ = the angular rotation (radians), and l = fi ber length (m). For this study, fi bers were subjected to a longitudinal tensile load of 10 g, with 90° of twist imparted at a rate of 6°/s. RESULTS AND DISCUSSION To assess variation in values recorded for each fi ber between experimental runs, the rela- tive change in modulus ((Run2–Run1)/Run1) was calculated and plotted against the Figure 5. Typical FTT950 measurement for hair/nylon.

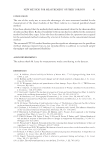
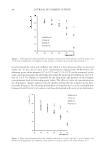
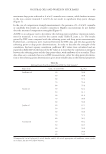
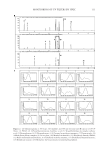
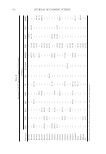
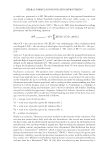
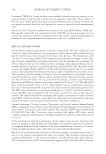
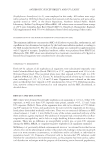
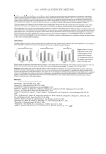
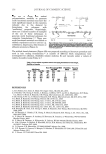
NEW METHOD FOR MEASUREMENT OF FIBER TORSION 89 average value obtained over two runs for each fi ber. These are shown in Figures 6 and 7, for nylon and hair, respectively. Nylon fi bers show a similar average modulus as measured on manual and automated instruments, measured as 0.418±0.017 GPa and 0.422±0.025 GPa, respectively. The average absolute difference between run 1 and run 2 (Figure 8) was larger for the manual technique (1.45%) than for the automated technique (1.04%). This difference was found to be statistically signifi cant when comparing the data sets in a paired t-test (p=0.03). Figure 6. Plot of normalized change in shear modulus of nylon fi bers between runs 1 and 2 versus average of both runs. Black dots show data from manual instrument white dots show data from automated instrument. Figure 7. Plot of normalized change in shear modulus of hair fi bers between runs 1 and 2 versus average of both runs. Black dots show data from manual instrument white dots show data from automated instrument.
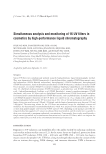
Purchased for the exclusive use of nofirst nolast (unknown)
From: SCC Media Library & Resource Center (library.scconline.org)