JOURNAL OF COSMETIC SCIENCE 162 • Include one method blank fortifi ed with organic lead in oil (low-level organic lead fortifi cation solution) in each digestion batch. • Include one method blank fortifi ed with inorganic lead (low-level inorganic lead fortifi cation solution) in each digestion batch. • Prepare each lipstick sample in duplicate. ICP-MS ANALYSIS Internal standardization was performed using a 195 Pt isotope. The analytical run began with a seven-point standard curve between 0.010 μg Pb/l and 25 μg Pb/l, with con- tinuing calibration verifi cation standards run every 15 samples. The daily calibration standard curves were calculated using linear regression (ELAN software). The instru- ment was tuned in the “normal” (no gas) mode to meet specifi cations for sensitivity, oxide ratio, and doubly charged ratio as detailed by Perkin Elmer. Analytical solutions and standards were merged online with the internal standard solution via a T-fi tting before the nebulizer. The method was set up to quantify lead using a sum of the iso- topes 206,207,208 Pb to account for isotopic variation between samples and standards. The 195 Pt isotope was measured for internal standardization. Prepared samples (analytical solu- tions) were analyzed using a dilution of 1/20 in 1% (v/v) nitric acid relative to calibra- tion standards using linear regression (y = ax + blank). No analytical solutions had internal standard signals that differed by more than 40% relative to the calibration blank. QUALITY CONTROL The correlation coeffi cient for the standard curve was greater than 0.997 in all cases. Calibration was verifi ed by analyzing a calibration blank and two quality control (QC) solutions (secondary inorganic lead stock solution and lead in water reference solution) immediately after calibration and after every 15 analytical solutions. The QC solution recovery was between 90% and 110%. One analytical solution from each digestion batch was diluted 1/40 with 1% nitric acid and compared with the same solution diluted 1/10 to evaluate matrix effects. Any analytical solutions with lead levels above the highest standard were further diluted to within the calibration range to determine the lead concentration. STATISTICAL COMPARISON OF MEAN LEAD VALUES AMONG COMPANIES Seven parent companies with 18 or more lipsticks from each company made up nearly 80% of the samples (319 out of 400 lipsticks). These seven companies (number of lip- sticks) were Companies A (77), C (21), D (41), E (20), F (18), G (117), and H (25). To test for signifi cant differences among companies, an analysis of variance (ANOVA) was per- formed using the mean lead value data. The log-transformed data were used in the ANOVA because they were more normally distributed. Since the overall ANOVA test was signifi cant at p ≤ 0.05, we performed a

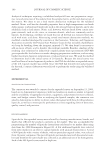
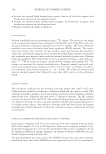
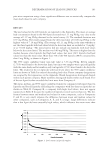
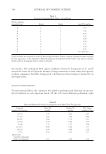
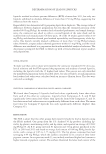
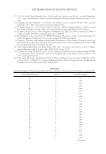
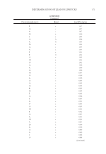
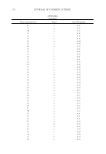
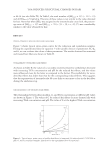
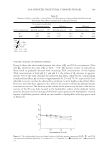
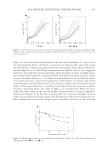
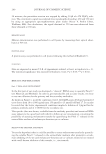
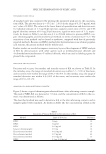
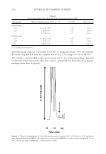
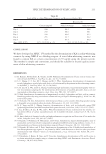
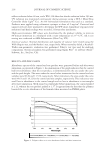
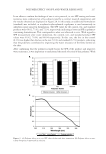
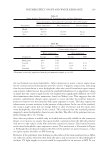
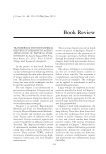
DETERMINATION OF LEAD IN LIPSTICKS 163 pair-wise comparison using a least signifi cant difference test to statistically compare the mean lead values for each company. RESULTS The lead values for the 400 lipsticks are reported in the Appendix. The mean or average lead concentration found in the 400 lipsticks tested was 1.11 mg Pb/kg, very close to the average of 1.07 mg Pb/kg obtained in the initial survey (1). The standard deviation was 0.97 mg Pb/kg. The results ranged from the detection limit of 0.026 mg Pb/kg to the highest value of 7.19 mg Pb/kg. (The average of 1.11 mg Pb/kg is the same whether or not the three lipsticks with lead values below the detection limit are included as “0 mg/kg” or as “0.026 mg/kg.” The initial survey did not include any lipsticks with lead values below the detection limit.) The median was 0.89 mg Pb/kg. The mean is higher than the median because a few lipsticks had high lead values, but most (247) lipsticks had lead values less than the mean value. More than 350 of the 400 lipsticks (88%) contained less than 2 mg Pb/kg, as shown in Figure 1. The 99% upper confi dence limit (one-tail) value is 3.36 mg Pb/kg. Eleven samples (2.75%) were found to be above that limit, but since two samples were a pair of lipsticks with the same shade and lot number, only ten lipsticks (2.5%) were found to be above the limit. The results for the ten lipsticks with lead levels above the 99% upper confi dence limit are shown in Table I in order of descending lead value. Parent company designations are assigned by fi rst appearance in the Appendix. Brand designations distinguish brands within each parent company. Shade numbers distinguish shades within each brand. Five of the ten lipsticks that exceeded this limit were from Company A. The mean, median, and 99% upper confi dence limits for companies with more than ten lipsticks and for all lipsticks (including the companies with less than ten lipsticks) are shown in Table II. Company B, a company with high lead values, does not appear separately in Table II because the number of lipsticks tested was less than ten. The dif- ference between mean and median lead values for some companies, such as Companies C and D, is very small, whereas the difference between mean and median values for other companies, such as Companies A, E, and F, is large. Large differences indicate that a few lipsticks have unusually high values, which infl uence the mean more than Figure 1. Lead content in lipstick samples.
Purchased for the exclusive use of nofirst nolast (unknown)
From: SCC Media Library & Resource Center (library.scconline.org)