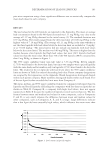
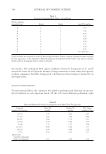
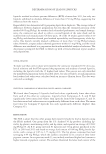
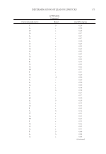
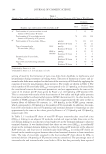
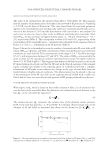
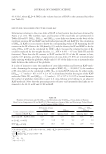
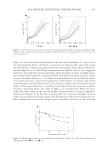
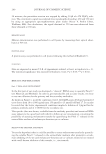
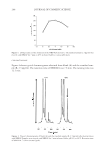
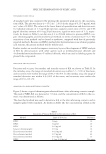
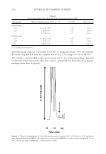
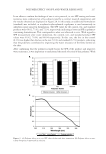
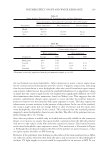
JOURNAL OF COSMETIC SCIENCE 164 the median. The individual 99% upper confi dence limits for Companies A, C, and F exceed the limit for all lipsticks because of large variations in lead values for lipsticks in those companies. Notably, Company A’s distribution of lead values is skewed by its fi ve high values. QUALITY CONTROL RESULTS To assess matrix effects, the contractor was asked to perform serial dilutions on one ana- lytical solution in each digestion batch. Of the 100 serial dilutions performed, eight Table II Mean and Median Pb Values for Companies with More Than Ten Lipsticks Company (number of lipsticks) Mean Pb mg/kg Median Pb mg/kg 99% Upper confi dence limit A (77) 1.25 0.93 4.35 C (21) 2.01 2.00 5.00 D (41) 1.68 1.70 3.31 E (20) 1.04 0.58 3.25 F (18) 1.47 1.07 4.48 G (117) 0.66 0.56 1.77 H (25) 1.00 0.86 2.14 I (11) 0.78 0.70 1.47 All lipsticks (includes companies with 10 lipsticks) 1.11 0.89 3.36 Table I Lipsticks Containing More Than 3.36 mg Pb/kg Parent company (manufacturer) Brand Shade Lead (Pb) mg/kg A a 1 7.19 A b 1 7.00 B a 1 4.93 C a 1 4.92 B a 2 4.89 A b 2 4.45 A b 3 4.41 C b 1 4.28 A a 2 4.23 F a 1 4.12 and 4.06 Lipstick results are reported in order of descending lead value. Parent company designations were assigned by fi rst appearance in the Appendix. Brand designations distinguish brands within each parent company. Shade numbers distinguish shades within each brand.

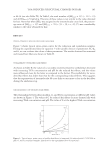
DETERMINATION OF LEAD IN LIPSTICKS 165 lipsticks resulted in relative percent differences (RPD) of more than 10%, but only two lipsticks exhibited an absolute difference of more than 0.30 mg Pb/kg, suggesting few infl uences from the matrix. Repeatability was demonstrated by preparing lipsticks in duplicate. The average value of differences between duplicate preparations was less than the estimated precision of the method (0.05 mg Pb/kg). As another check of method performance and sample homoge- neity, the contractor was asked to collect a second lipstick of the same shade and lot number from each manufacturer. Of these pairs, 18 of the 19 results agreed within 0.10 mg Pb/kg and therefore showed good method repeatability and homogeneity of the lip- sticks. One lipstick initially showed a difference of more than 3.0 mg Pb/kg between tubes. However, a repeat analysis showed agreement within 0.3 mg Pb/kg, and the initial difference was attributed to a preparation batch with mislabeled analytical solutions. The discrepancy prompted the FDA to follow up with several additional repeat analyses and preparations. CHECK ANALYSES To make sure that correct values were reported, the contractor reanalyzed 10% of its ana- lytical solutions and the FDA repeated the preparations and analyses of several lipsticks, including the lipsticks with the 15 highest lead values. This process not only identifi ed the mislabeled preparation batch described above, but also revealed a second preparation batch whose lead values were calculated with an incorrect dilution factor. The data were corrected accordingly. STATISTICAL COMPARISON OF MEAN LEAD VALUES AMONG COMPANIES We found that Company G lipsticks had lead values signifi cantly lower than those from each of the other six companies. Lipsticks from Companies A, E, and H had signifi cantly lower mean lead values than lipsticks from both Companies C and D, but their mean lead values were not signifi cantly different from each other. The mean lead value for Company F lipsticks was only signifi cantly different (higher) than Company G’s. DISCUSSION The FDA is aware that two other groups have reported results for lead in lipsticks using the FDA’s method. One group from the U.S. analyzed 56 lip products including lip- sticks, lip glosses, moisturizing sticks, and lip stains, and reported an average of 0.9932 mg Pb/kg (9). An E.U. group surveyed 81 lipsticks and 32 lip glosses purchased in the E.U. in 2010 and 2011 and found an average lead content of 0.86 mg Pb/kg for the lip- sticks, with a range of 0.05 to 3.75 mg/kg (10). The lip glosses contained less lead (averaging 0.44 mg Pb/kg), which the authors considered to be a result of their lower pigment content. In our previous work (1), we similarly attributed higher lead content to higher mineral or pigment content. The authors illustrated the lower lead content of the
Purchased for the exclusive use of nofirst nolast (unknown)
From: SCC Media Library & Resource Center (library.scconline.org)