INHIBITORY EFFECTS OF GERANIC ACID 353 and washed twice with water. After the addition of 1 ml of EtOH, the plates were shaken for 10 min at room temperature. UV absorption was measured at 590 nm (19). DETERMINING MELANIN CONTENT After the removal of media from each well, the plate was washed with PBS, followed by the addition of 1 ml of 1 N NaOH to each well to lyse the cells for the release of melanin. The UV absorption was measured at 405 nm. Phenylthiourea (PTU) was employed as a positive control (20). WESTERN IMMUNOBLOTTING ANALYSIS The Melan-a cells were harvested and extracted in a triple-detergent lysis buffer [50 mM Tris-HCl (pH 8.0), 150 mM NaCl, 0.02% sodium azide, 0.1% sodium dodecyl sulfate (SDS), 1% nonyl phenoxypolyethoxylethanol (NP-40), 0.5% sodium deoxycholate, 100 μg/ml of phenylmethylsulfonyl fl uoride (PMSF), and 1 μg/ml of aprotinin]. The protein content was then measured with a protein assay kit (Bio-rad, Hercules, CA). Next, 50 μg of the protein was separated on 8% SDS-polyacrylamide gel and transferred to a Hybond enhanced chemiluminescence (ECL) nitrocellulose membrane (Amersham Pharmacia Biotech, Buckinghamshire, UK). The membranes were blocked with 5% skim milk and incubated with tyrosinase (Santa Cruz Biotech, Santa Cruz, CA 1/250 dilution) primary antibody or dopachrome tautomerase (TRP-2, Santa Cruz Biotech, 1/300 dilution) pri- mary antibody, and anti-goat secondary antibodies. Detection was performed using ECL (Amersham Pharmacia Biotech, Piscataway, NJ). The Western blot results obtained by the scanner were photographed (HP, Palo Alto, CA). Density of protein bands was mea- sured using Image J program by National Institute of Health (NIH) (21). MEASURING INHIBITORY EFFECT ON TYROSINASE ACTIVITY Tyrosinase activity was measured by its dopa-oxidase activity, using a slightly modifi ed version of the method reported by Shono and Toda (22). Each concentration (1 mM, 500 μM, 100 μM, and 10 μM) of the test substance was dissolved in MeOH. Next, 120 μl of L -Dopa (5 mM, dissolved in a 67 mM phosphate buffer, pH 6.8) and 40 μl of either the same buffer or the test sample were added to a 96-well microplate, after which 40 μl of mushroom tyrosinase (125 U) was added. The quantity of dopachrome in the reaction mixture was measured after 20 min of incubation at 37°C. Based on the optical density at 490 nm (OD 490), the inhibitory activity of the sample was expressed as the concentra- tion required to effect an inhibition of enzyme activity of 50% (IC50). Kojic acid was utilized as the reference material (23). STATISTICAL ANALYSIS The data are expressed as the means ± S.D. from three independent experiments. Statisti- cal comparisons between the different treatments were conducted via analysis of variance.

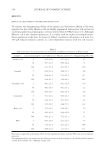
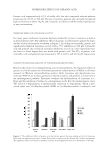
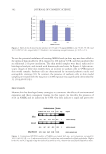
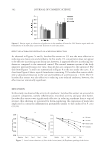
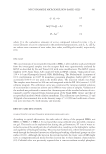
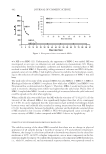
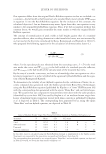
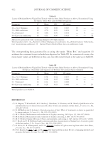
JOURNAL OF COSMETIC SCIENCE 354 RESULTS EFFECTS ON CELL VIABILITY AND MELANIN PRODUCTION To evaluate the depigmenting ability of the geranic acid derivatives, Melan-a cells were employed in this study. Melan-a cells are highly pigmented melanocytes and provide an excellent parallel non-tumorigenic cell line derived from C57BL/6 mice (24). Although Melan-a cell is not a human melanocyte, it is widely used for studies of melanin biosyn- thesis regulation in the skin. As shown in Table I, treatment with geranic acid from 5 to 500 μM reduced melanin contents in a dose-dependent manner, with low cell toxicity. Table I Effects of Geranic Acid Derivatives on Cell Growth and Melanin Production in Melan-a Cells Samples Concentrations (μM) Cell viability (%) Melanin content (%) Depigmenting effect (%)a Geranic acid 5 96.2 ± 0.9 92.7 ± 5.9 3.5 50 96.7 ± 1.6 89.6 ± 4.4 7.1 500 91.7 ± 3.4 66.1 ± 6.7 25.6 Geraniol 5 99.6 ± 2.6 98.8 ± 5.1 0.8 50 90.8 ± 2.6 91.5 ± 3.9 −0.7 500 61.4 ± 5.5 34.9 ± 4.3 26.5 Citronellic acid 5 98.2 ± 1.2 99.2 ± 2.8 −1.0 50 98.2 ± 4.3 96.1 ± 3.1 2.1 500 90.6 ± 4.7 84.2 ± 9.3 6.4 Citronellol 5 97.2 ± 4.1 96.6 ± 3.2 0.6 50 91.4 ± 2.6 87.1 ± 3.0 4.3 500 47.0 ± 8.7 34.8 ± 7.5 12.2 Kojic acid 5 97.5 ± 2.3 95.6 ± 4.7 1.9 50 94.1 ± 3.6 90.6 ± 5.8 3.5 500 84.3 ± 3.1 79.2 ± 5.1 5.1 PTU 5 96.4 ± 5.0 91.1 ± 2.9 5.3 50 79.0 ± 5.5 40.2 ± 6.5 38.8 500 68.8 ± 4.9 21.7 ± 5.3 47.1 Each value is expressed as the means ± S.E. of three experiments. Kojic acid and PTU were used as reference materials. a Depigmenting effect was expressed as the difference between the percentage of cell viability and the melanin content [Cell viability (%) − Melanin content (%)].
Purchased for the exclusive use of nofirst nolast (unknown)
From: SCC Media Library & Resource Center (library.scconline.org)