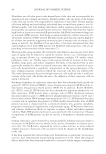
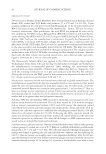
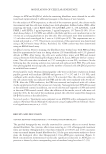
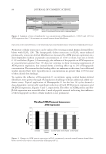
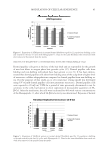
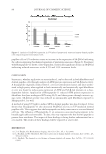
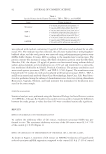
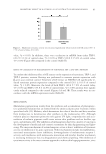
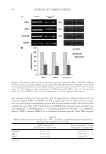
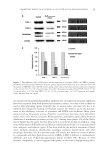
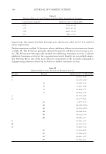
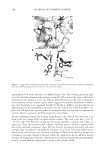
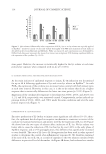
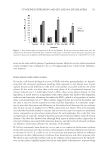
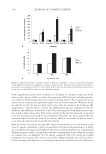
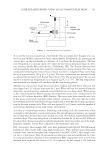
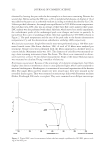
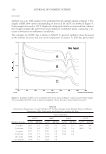
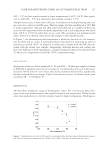
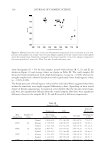
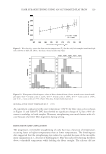
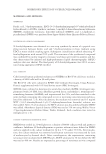
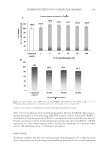
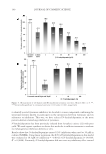
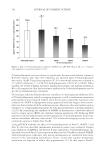
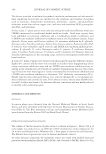
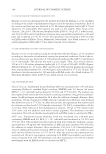
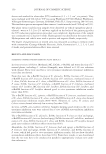
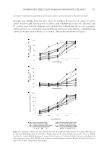
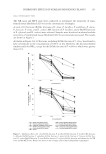
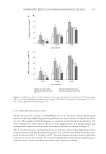
JOURNAL OF COSMETIC SCIENCE 154 As shown in Figure 3B, 10 fractions, including EtOAc fraction of S. china, were found to have cytotoxicity at the concentration of 0.01% or less. However, the fractions showed similar results for MTT50 except for the EtOAc fractions of E. offi cinalis and P. trifoliata, which were greater than 0.1%. As indicated by the results of cytotoxicity testing (NR assay and MTT assay), the proper concentration of test material was determined to be approximately 0.001%, which showed relatively good cell survival results for intracellular assay. INTRACELLULAR TYROSINASE INHIBITION The method used for the evaluation of the depigmenting effect using melanocytes has an advantage in that it can be used to analyze the overall effects of sample on melanin biosynthesis. However, since this method is complex and time consuming, it is diffi cult to perform multiple sample tests simultaneously. Therefore, from the result of the in vitro tyrosinase inhibition test, L -DOPA auto-oxidation inhibition test, and melanin synthesis inhibition test, 4 out of 10 plant fractions were selected for the intracellular tyrosinase inhibition test. The EtOAc fractions of S. china, P. lactifl ora, and P. umbellatus and BuOH fraction of E. offi cinalis showed better inhibition effects than arbutin in two or more of the effi - cacy tests. The appropriate concentrations of test materials were determined to be 0.001%, 0.0025%, and 0.005% from the results of cytotoxicity tests. Samples were dissolved in DMEM, and the intracellular tyrosinase inhibition test was conducted using B16 melanoma cells with arbutin as a control. The four frac- tions showed signifi cant increases in intracellular tyrosinase inhibition as their con- centrations increased. The levels of inhibition by EtOAc fractions of S. china and P. umbellatus and BuOH fraction of E. offi cinalis were similar to that of arbutin. However, the EtOAc frac tion of P. lactifl ora showed a signifi cant, excellent tyrosinase inhibition effect compared to arbutin (Figure 4A). The IC50 values were 19.9 μg/ml for P. lactifl ora, 43.8 μg/ml for E. offi cinalis, 43.5 μg/ml for P. umbellatus, and 50 μg/ml of S. china and arbutin. INTRACELLULAR MELANIN SYNTHESIS INHIBITION The same fractions used in the intracellular tyrosinase inhibition test were dissolved in DMEM, and the intracellular melanin synthesis inhibition test was conducted us- ing B16 melanoma cells with arbutin as a control. The four fractions showed a sig- nifi cant increase in intracellular melanin biosynthesis inhibition as the concentration increased. The levels of inhibition by EtOAc fractions of S. china and P. umbellatus and BuOH fraction of E. offi cinalis were similar to that of arbutin. However, the EtOAc fraction of P. lactifl ora showed a signifi cant, excellent melanin biosynthesis inhibition effect compared to arbutin (Figure 4B). The IC50 values were 16.6 μg/ml for P. lactifl ora, 26.7 μg/ml for E. offi cinalis, 32.1 μg/ml for P. umbellatus, and 50 μg/ml or more for S. china and arbutin.

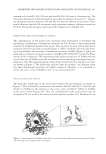
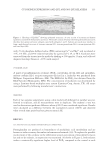
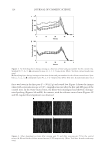
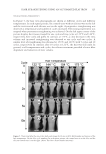
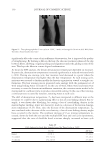
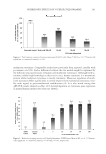
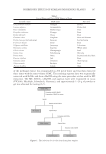
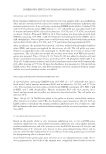
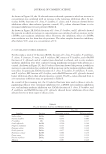
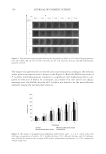
INHIBITORY EFFECTS OF KOREAN INDIGENOUS PLANTS 155 IN VIVO DEPIGMENTING EFFICACY TEST EtOAc fraction of P. lactifl ora and BuOH fraction of E. offi cinalis, which showed good results for the intracellular depigmenting effi cacy test, were selected as samples for the in vivo test. The samples and hydroquinone as a positive control dissolved in vehicle to 2% were evaluated for their topical effects on skin pigmentation of a brown guinea pig through daily application for 6 weeks of treatment. Results are shown in Figure 5. The P. lactifl ora fraction- and hydroquinone-treated sites showed skin-lightening effects as time increased, but the skin-lightening effect of E. offi cinalis was slight. From the view- point of adverse effects, P. lactifl ora- and E. offi cinalis-treated sites have shown slight skin irritation on one or two animals. In contrast, hydroquinone-treated sites showed signs of irritation after 2 weeks and these signs were more intense at 6 weeks. Figure 4. Inhibitory effects on (A) tyrosinase activity and (B) melanin biosynthesis in B16 melanoma cells (% of control). Results are shown as the averages ± SD of three independent experiments. *p 0.05 **p 0.01 compared to arbutin using a t-test.
Purchased for the exclusive use of nofirst nolast (unknown)
From: SCC Media Library & Resource Center (library.scconline.org)