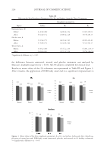
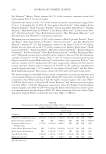
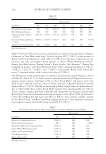
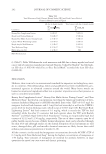
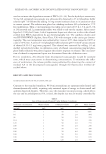
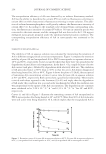
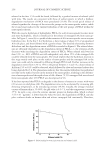
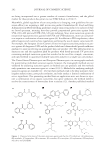
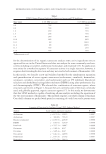
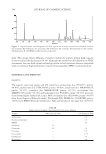
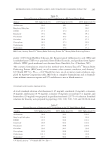
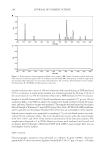
THAI AROMATIC PLANT EXTRACTS IN ANTIWRINKLE BODY CREAMS 227 FORMULATION AND STABILITY TEST OF EOB BODY CREAM The freshly prepared EOB body cream and cream base were also examined for their phys- ical stabilities against heating-cooling cycling. Both freshly prepared and after-stability testing, the EOB body cream showed good appearance with a pale yellow color, smooth and homogeneous texture, and its pH was only slightly changed. No cracking or cream- ing was observed. The product had good spreadability on the skin, as shown in Table II. CLINICAL EVALUATION OF WRINKLE-REDUCING CAPACITY OF EOB BODY CREAM Photodamaged skin is characterized by fi ne and coarse wrinkling, rough texture, shallow color, and uneven pigmentation. Measuring effects on skin surface texture and wrinkles is one way to investigate the effi cacy of “antiaging” products. The effect of the EOB body cream on skin surface texture was evaluated in a 4-week clinical study with 29 human subjects using the Skin Visiometer® (17). Three parameters were analyzed (Ra, Rz, and surface). Paired sample tests were used to examine changes in values, before and after each treatment (untreated, treated, and placebo). Posttreatment, Figure 2. IC50 value (mg/ml) of cream base and EOB cream (body massage cream) on TBARS assay for lipid peroxidation before and after heating-cooling cycling test. Table II Physical Properties of EOB Body Cream Before and After Stability Testing Topics EOB body cream Before After pH 7.11 7.10 Physical properties Color Pale yellow Pale yellow Texture Smooth and homogeneous Smooth and homogeneous Consistency Tender Tender Odor Unique fragrant odor Unique fragrant odor (no change) Spreadability Very good Very good Feel on skin Soft Soft Enriched skin glossy Enriched skin glossy

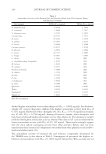
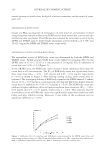
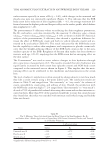
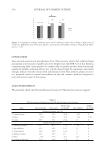
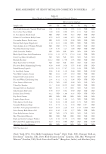
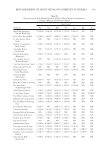
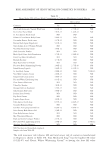
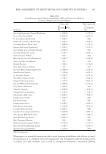
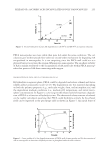
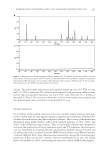
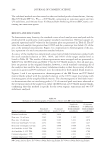
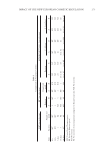
JOURNAL OF COSMETIC SCIENCE 228 the difference between untreated, treated, and placebo treatment was analyzed by Duncan’s multiple range test ( p 0.05). All 29 subjects completed the clinical trial. Results as mean values of the 29 volunteers are represented in Table III and Figure 3. After 4 weeks, the application of EOB body cream led to a signifi cant improvement in Figure 3. Mean values of the skin roughness parameters, Ra, Rz, and surface, before and after 4 weeks ap- plication of cream base and EOB body cream (untreated, placebo, and treated) in 29 healthy volunteers. *= Signifi cantly different at p 0.05. Table III Effect on the Skin Roughness Parameters, Ra, Rz, and Surface, from the Three Treatments Topics Roughness parameters Surface Ra Rz Untreated area, N Before 6.20 ± 0.80 14.88 ± 2.54 63.63 ± 9.81 After 6.02 ± 0.72 13.88 ± 2.28 59.76 ± 8.33 Placebo area, B Before 5.92 ± 0.73 14.29 ± 2.65 60.92 ± 9.40 After 5.78 ± 0.72 13.38 ± 2.60 57.34 ± 9.37 Treated area, A Before 5.98 ± 0.80 14.44 ± 2.50 61.89 ± 10.37 After 5.69 ± 0.61 13.32 ± 2.30 55.79 ± 8.63* *Signifi cantly different at p 0.05.
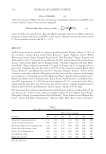
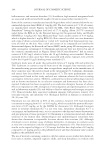
Purchased for the exclusive use of nofirst nolast (unknown)
From: SCC Media Library & Resource Center (library.scconline.org)