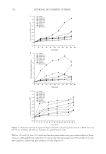
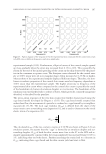
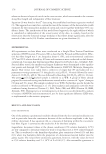
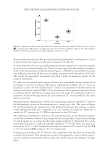
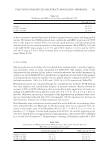
JOURNAL OF COSMETIC SCIENCE 180 fi ts on the basis of the core/shell model thus turn out to not be suitable to estimate the torsional loss modulus of the cortex. In contrast, tanδ – values for the cuticle with the applicable values for G″cu and G′cu (see Table I) yield a range of tanδ = 0.01–0.02, in acceptable agreement with expectation values for keratins for roughly comparable conditions (18–20,26–28). This gives some support for the overall validity of the estimated G″cu values in the absence of reference values. Because of the systematic decrease of G″ with I, the estimates for G″cu are substantially higher than the G″ means, though they follow the same pattern for all samples. The over- all behavior for G″cu is as to be expected for a material below the glass transition, in that G″cu decreases with an increase of G′cu for a sample and vice versa. The G″ value is reduced by a factor of about 2 compared to the virgin hair through the chemical processing of reduction and oxidation (WB), in line with considerations of in- creased stiffness and brittleness of the cuticle (3). Although the effect of the additional Figure 4. G″ versus polar moment of inertia for virgin (A:V), perm-waved and bleached (B: WB), and ad- ditionally shampoo-treated (C: WBS) hair. Solid lines are based on the fi t of equation (9).

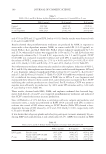
THE TORSIONAL LOSS MODULUS IN HUMAN HAIR 181 “repair” treatment (WBS-sample) is small for G′cu, the corresponding value of G″cu increases well beyond the value for virgin hair. This not only indicates that the “repair” agent improves the overall structural integrity of the cuticle but also introduces through its components, possibly, namely, through the polymer content a strong viscous compo- nent, which contributes to the increase of G″cu. CONCLUSIONS Using the values for the storage modulus, G′ and the logarithmic decrement Λ as param- eters obtained from the free torsional oscillation experiment on hair the values for the loss moduli G″ were determined. The raw data show a rather low discriminative power be- tween the different samples, despite their rather strong chemical pretreatment. This can be attributed to a strong component of variance due to the systematic decrease of G″ with fi ber moment of inertia. This decrease is associated with a decrease of the area fraction of the cuticle in the fi ber cross-section, when the fi bers get thicker. The effect is accounted for by a core/shell model for the cortex/cuticle structure of hair, yielding satisfactory coef- fi cients of determinations. These model fi ts may be used, with due caution with respect to Type I errors, to improve the discriminative power for G″ measurements, when inves- tigating hair samples with different processing histories. The more speculative aspects of the investigation relate to the determination of the loss moduli for cortex and cuticle. While the determination of G″co proved to be unsuccessful, values for G″cu show overall consistency. The distinct and plausible differences between the loss moduli for the cuticle for the samples support previous suggestions (3) that torsional measurements in the appropriate model context are a very sensitive tool to assess changes of the properties of the hair cuticle through cosmetic processes and ingredients, in line with expectations by Robbins (13). In conclusion and in agreement with Bogaty’s (1) considerations, it is sug- gested that imparting the appropriate balance of torsional storage and loss moduli in hair by cosmetic processes and products will make a major contribution to their ability to control the dynamic movement of a hair style in line with consumer expectations. ACKNOWLEDGMENTS The authors are indebted to Mr. J. Karwey, who through his BSc thesis provided the data basis for our investigation. The thesis was prepared in the context of a collaboration between the University of Applied Sciences of Suedwestfalen (Germany) and Cognis GmbH (now BASF Personal Care and Nutrition GmbH), Duesseldorf (Germany). Table I Estimates for the Loss Moduli of Cortex (G″co) and Cuticle (G″cu) Together with their 95% Confi dence Limits, as Obtained by Fits of Equation (9) to the Data in Figure 4 Sample G″co, GPa G″cu, GPa r2 G′co, GPa G′cu, GPa V (69) 0 ± 0.005 0.08 ± 0.01 0.722 0.61 3.60 WB (56) 0 ± 0.004 0.046 ± 0.004 0.600 0.40 4.84 WBS (23) 0 ± 0.009 0.11 ± 0.08 0.733 0.37 4.63 The number of measurements for each sample is given in brackets. r2 are the coeffi cients of determination for the fi ts. Furthermore, values for the storage moduli for cortex (G′co) and cuticle (G′cu) are given (3) to aid the discussion.
Purchased for the exclusive use of nofirst nolast (unknown)
From: SCC Media Library & Resource Center (library.scconline.org)