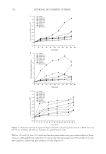
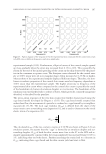
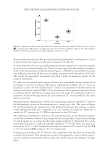
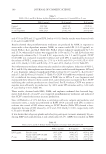
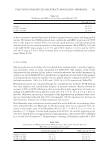
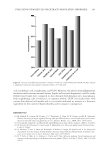
JOURNAL OF COSMETIC SCIENCE 178 APPLICATION OF THE CORE/SHELL MODEL When plotting G″ against the moment of inertia for all samples, systematic decreases are observed (see Figure 4), similar as for G′ (3,4). These observations are generally in line with data by Leray and Winsey (22) from torsional stress relaxation for both modulus and relaxation gradient. As for G′, this highlights that G″ for hair is not a material constant. The decrease as such is in line with the core/shell model [equation (9)] and implies that the cuticle has a higher G″ value than the cortex, as related to the limiting values for G″ at low and high values of I, respectively. The observation that G′ and G″ values both decrease with increasing moment of inertia (3) implies that both storage and loss modulus are higher for the cuticle than for the cor- tex. For the current cases, the correlated changes of G″ and G′, as shown in Figure 3, lead to the compensation effects for Λ, as mentioned earlier. Equation (9) was fi tted to the data applying nonlinear regression. The free optimization showed that the estimate for G″co gave slightly negative values in all cases (G″co ≥ -0.005 GPa), which is physically not reasonable. For this reason, G ≥ 0 was introduced as a boundary condi- tion for the fi t. Table I summarizes the results of the fi ts for G″co and G″cu together with the associated 95% confi dence ranges and the coeffi cients of determination r2. The solid lines through the data in Figure 4 are based on equation (9) and the parameter values in Table I. Figure 2. Summary of (A) G″ data and (B) G′ data for all samples. Data are given as means ( ), standard errors (SE) (boxes), and limiting values for the 95% confi dence range (1.96 × SE: whisker). Insets give the results of least signifi cant difference (LSD) multiple comparison of means tests with their levels of signifi cance ( p values). If p 0.05, effects are signifi cant on the 95% level.

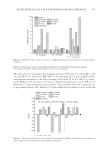
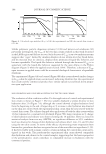
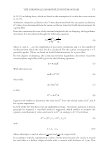
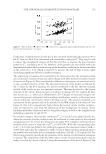
THE TORSIONAL LOSS MODULUS IN HUMAN HAIR 179 Coeffi cients of determination for the fi ts of the core/shell model through equation (9) to the G″ data (see Table I) are substantial and comparable to those for G′. They may be used to reduce the unexplained variance of the data and thus to improve the discriminative power for G″, similarly as for G′ (3). However, in the present case, this would need to be implemented with added caution in view of the boundary condition for the loss modulus of the cortex (G″co ≥ 0), which is expected to increase the risk of Type I errors, when identifying signifi cant differences between samples. The application of equation (9) is justifi ed by the observation that the torsional moduli are not material constants of hair, but rather change with fi ber diameter or rather moment of inertia (see Figure 4). This is attributed to differences of properties of cortex and cuticle in the core/shell structure of hair. The observed limitation of the model, as refl ected by the r2 values for the fi t of equation (9), may be attributed to the fact that the torsional moduli of the cuticle are not true material constants. This may be related to the layered structure of the cuticle, which in practice is subject to damage (23,24), namely, by ther- mal stresses as, e.g., refl ected in delamination (25). Changes of structural integrity are expected to generate substantial and overriding contributions, namely, to frictional inter- actions within the cuticle layers, which will impact on G″. This may be considered as an explanation for the apparent lack of fi t, namely, for the WB sample at low values of I (see Figure 4), that is for comparatively high-volume fractions of cuticle. Further complica- tions are expected to arise from the limitations of the assumptions of constant cuticle thickness with fi ber diameter as well as along fi ber length, as well as the simplifi cations underlying equations (3) and (9) (7). For all three samples, the boundary condition G″co ≥ 0 needed to be applied for the fi ts, where the necessity for this condition may be attributed to some extent to the required extrapolation to I→. Given this restriction, the upper 95% confi dence limit for the loss modulus of the cortex in virgin hair is G″co = 0.005 GPa. With the corresponding value of G′co = 0.61 GPa (see Table I) this yields with equation (6) a maximum value of tanδco = 0.008. This value may be compared to tanδ = 0.022 of rhinoceros horn perpendicular to the growth direction under not too dissimilar conditions (110 Hz, 5.2% regain) (18). For this testing geometry, specifi cally the properties of the matrix, are determined, analogous to torsion. The comparison of the data shows that even the calculated maximum value for tanδco is too low by a factor of about 3 using the extrapolation of the data in Figure 4. The Figure 3. Plot of Λ data ( ) and G″ data ( ) versus G′ for virgin hair. Linear regression lines and the coef- fi cients of determination r2 are given.
Purchased for the exclusive use of nofirst nolast (unknown)
From: SCC Media Library & Resource Center (library.scconline.org)