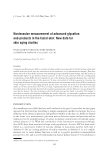
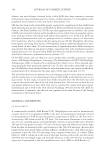
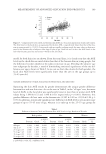
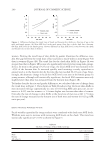
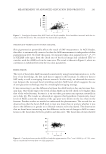
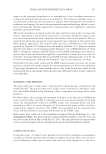
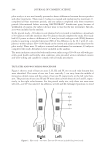
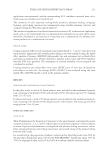
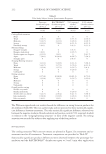
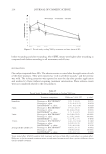
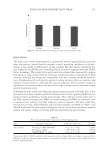
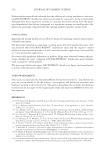
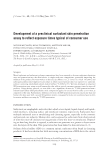
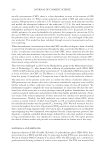
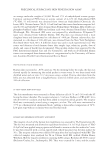
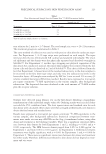
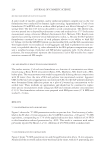
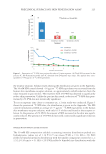
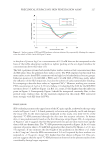
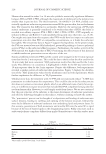
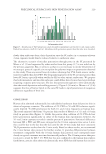
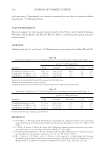
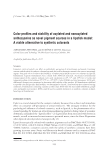
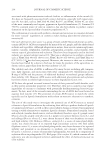
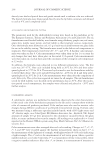
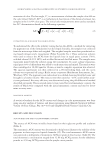
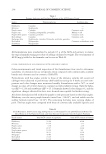
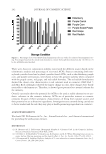
JOURNAL OF COSMETIC SCIENCE 226 smaller component centered at rh = 1.28 ± 0.03 nm (n = 2). Additional details as well as small angle neutron scattering results are available from the authors (13). The SLS micelle radius was approximately one half that of the SDS micelle radius of 2.1 nm reported by Moore et al. (1), which was measured in 100 mM NaCl. The difference may be largely attributed to the effect of added salt, which is well known to swell SDS micelles (14). CMC AND RELATED SURFACE TENSION MEASUREMENTS The SLS sample yielded a surface tension profi le characteristic of an anionic surfactant containing one or more highly surface-active impurities (Figure 4). A minimum value of γ = 19.9 mN/m was obtained at an SLS concentration (C) of 3.1 mM. For comparison, pure SDS yields γ 38 mN/m at its CMC of 8.2 mM (15). There was an infl ection point Figur e 3. Penetration of 14 C-SDS into human skin + receptor solution after a 2-min exposure (Experiment 2). Figu re 2. (A) Total penetration of 14 C-SDS into human skin + receptor solution after a 10-min exposure (Experiment 1) (B) Penetration profi le into human SC obtained from D-Squame tape strips.

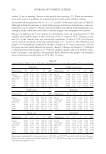
PRECLINICAL SURFACTANT SKIN PENETRATION ASSAY 227 in the plot of γ versus log C at a concentration of 0.23 mM that can be interpreted on the basis of the Gibbs adsorption isotherm as tighter packing at the air–liquid interface for concentrations above this value (15). The SLS + polymer systems both yielded lower surface tension at low concentrations than did SLS alone thus, the polymers were surface active. The PVA employed in this study was more surface active than PEO, consistent with its high level of unhydrolyzed acetate groups. Infl ection points at 0.22 mM (SLS + PEO) and 0.36 mM (SLS + PVA) may partly refl ect the infl uence of the SLS impurities, but also the advent of surfactant/polymer binding. It is tempting to describe these values as “apparent CACs.” However, working at a constant PEO concentration of 2 g/l or 0.2% w/v, Cabane (11) identifi ed the CAC for the SDS/PEO system as about 5.5 mM (see Figure 1 in Ref. 11), some 25-fold higher than the infl ection point in Figure 4. Consequently, Figure 4 should be interpreted cautiously. But, it does provide some evidence that, for the materials employed in this study, PEO interacted more strongly with SLS than did PVA. DISCUSSION SDS evidently penetrates the upper layers of the SC quite rapidly, as shown by the tape-strip results in Figures 1 and 2. It binds primarily to keratin and gradually swells and disrupts the tissue (16). In the short exposures employed in this study, very little ( 1%) of the deposited 14 C-SDS permeated through the skin into the receptor solutions. In human skin, it was predominately found on the fi rst three tape strips (Figure 2B). A comparison of Figures 1 and 2 suggests that free SLS penetrated into porcine skin much more rapidly than it did into human skin. The 14 C-SDS penetration reported in Figure 1A for a 10-min exposure of porcine skin to 50 mM SLS approaches that observed by Moore et al. (1) in a 5-h exposure. If one estimates the dry weight of the epidermis in the Moore et al. study to be 6.5 mg/cm2, then the SDS concentration of 2.6 wt% reported by these workers cor- responds to ~170 μg/cm2, about 70% higher than that shown in Figure 1A. The com- parison suggests that the rapid 14 C-SDS penetration observed in the present studies slows considerably during longer exposures. Figure 4. Surface tension of SDS and SDS/polymer solutions obtained by sequentially diluting the composi- tions described in Table I with Millipore™ water.
Purchased for the exclusive use of nofirst nolast (unknown)
From: SCC Media Library & Resource Center (library.scconline.org)