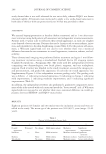
J. Cosmet. Sci., 71, 351–360 (September/October 2020) 351 Bias in Sunscreen SPF Testing: A Review of Published Data TRINA RICCI, ANDREW MARRA, KAREN RAUEN, and MICHAEL CASWELL , Consumer Product Testing Company, Inc., Fairfi eld, NJ (T.R., A.M., K.R., M.C.) Accepted for publication March 31, 2020. Synopsis Subversion bias, a type of selection bias, through manipulation of subject recruitment compromises data validity. This study explores the possibility of subversion bias in sunscreen sun protection factor (SPF) testing. It has been established that subjects with lower minimal erythemal dose (MED) values exhibit higher sunscreen SPF values. Consistency of this response is determined in subjects who participated in multiple sunscreen effi cacy clinical trials. All trials determined the SPF of the sunscreen standard P2. Of the 652 subjects with greater than three observations (n = 286), 35 subjects consistently had values either well above (n = 29) or below (n = 6) the average SPF value of the dataset (15.6 ± 1.2). The difference between the average SPF by the subject exhibiting the highest average SPF for P2, 19.8 ± 0.9, and the subject exhibiting the lowest average SPF for P2, 12.3 ± 2.6, is 7.5 SPF units, or 61%. Recruitment strategies based on historical SPF values for an individual would be considered subversion bias. Foreknowledge of those subjects with consistent results either in favor or not in favor of SPF testing outcomes could be exploited and would provide a reason for variation in results among testing facilities. INTRODUCTION The p rinciples of good clinical practice (GCP) include minimizing bias and maximizing precision (1,2). The ability to detect bias in a clinical trial is important to assess the valid- ity of the results. Validity refers to the degree to which a clinical trial accurately delivers the specifi c concept (e.g., data) that is attempted. External validity refers to the extent to which the results of a study are generalizable or transferable. The t hree types of clinical trial bias are information bias, confounding bias, and selection bias. Selection bias occurs when selection, enrollment, or continued participation of a subject in a clinical trial is somehow dependent on the likelihood of having the outcome of interest. Sub- version bias, a type of selection bias, occurs when the clinical team manipulates subject recruit- ment. Different types of subversion bias can occur. Herein, we provide evidence for the possibility of subversion bias in sunscreen sun protection factor (SPF) testing. The S PF of a sunscreen on a subject is inversely dependent on that subject’s unprotected minimal erythemal dose (MED) (3–5). In 1993, Kawada et al. (3) reported data on 48 differ- ent subjects. In 1999, Damien et al. (4) reported data on 45 different subjects from fi ve differ- Address all correspondence to Trina Ricci at tricci@cptclabs.com .

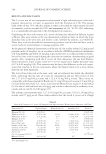
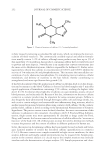
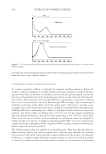
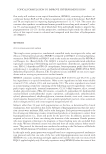
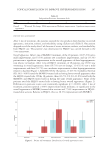
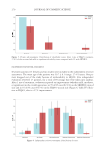
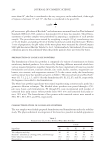
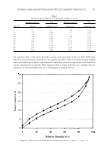
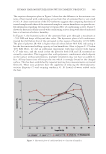
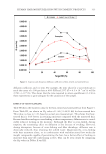
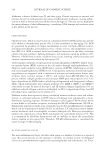
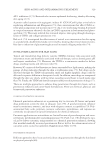
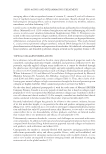
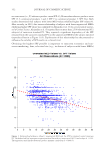
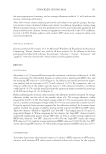
JOURNAL OF COSMETIC SCIENCE 352 ent sunscreens (i.e., P3 reference product: mean SPF 4.5 Homosalate reference product: mean SPF 15.5 commercial products 1 and 2: SPF 15+ commercial product 3: SPF 30+). Both studies determined that subjects with lower MED values exhibited higher SPF values (4). More recently, in 2019, this inverse relationship of subjects with lower unprotected MEDs exhibiting higher SPF values was confi rmed by Alejandria et al. (5). In a recent article in Jour- nal of Cosmetic Sciences, Alejandria et al. (5) reported data on more than 2,500 observations (652 subjects) of sunscreen standard P2. They reported a signifi cant dependency of the SPF obtained from the sunscreen standard P2 on the unprotected MED of the subject reported (reproduced herein as Figure 1) (5). Exploitation of this relationship has the potential to infl uence the validity of SPF results in a clinical trial. Obtai ning the highest SPF possible is important to sunscreen economics and sun- screen marketing thus, selection bias (e.g., inclusion of subjects with lower MEDs) F i gure 1. Relationship between a subject’s unprotected MED and the SPF for standard control sunscreen P2. The dashed red line represents a regression trend line with a y intercept of 18.579 and a slope of -0.155. The regression trend line has Pearson’s product moment correlation of -0.409 (5).
Purchased for the exclusive use of nofirst nolast (unknown)
From: SCC Media Library & Resource Center (library.scconline.org)