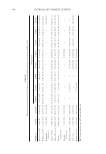
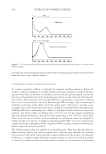
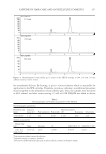
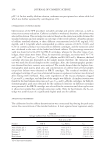
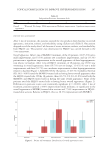
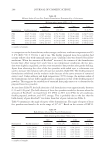
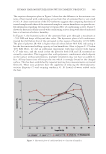
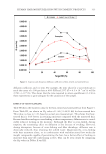
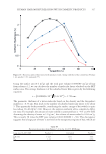
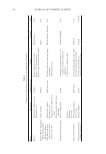
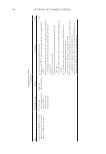
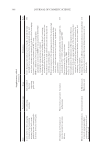
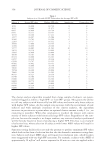
RICESORB® FOR LOOSE FACE POWDERS 299 and NF 36 (10), overall, the loose face powders showed rather good fl ow property. In the case of freshly prepared formulations, it was observed that the higher the amount of RiceSorb® in the formulations, the lower the angle of repose was obtained. The formula- tion FT4, which contained the highest amount of RiceSorb®, had excellent fl ow property (30°), whereas the formulation FT0 (0% RiceSorb®) showed fair (aid not needed) fl ow property (37°). However, after storage for 2 mo at ambient temperature and 45°C, poorer fl ow property of the formulation FT4 was obtained, as indicated by signifi cantly higher angle of repose (p 0.05). This is likely caused by the moisture absorption capacity of RiceSorb®. The angle of repose of formulation FT0 which contained only talcum was similar for all conditions. Several factors have been reported to infl uence the angle of repose including particle size, shape, morphology of substances, and MC (13). The MC (%) of all formulations was inves- tigated, and the results are given in Table VI. The loose face powder formulations, FT0 through FT4, displayed signifi cant differences in percentages of MC for all conditions (p-value 0.05). The highest MC was observed in the formulation FT4 which contained the greatest amount of RiceSorb®. The formulation FT0 which had no RiceSorb® showed the lowest MC. Under storage conditions, the formulations FT3 and FT4 had statistically higher MC than the freshly prepared formulations (p-value 0.05). Lesser changes were observed in the case of formulation FT0 containing only talcum. Noticeably, the amount Table V Angle of Repose of Loose Face Powder Formulations Formulation Angle of repose (o), (mean ± SD, n = 3) Freshly prepared 1 mo 1 m 2 mo 2 mo Ambient 45 ± 2°C Ambient 45 ± 2°C FT0 36.72 ± 1.51 37.95 ± 0.58 37.95 ± 0.58 34.97 ± 1.26 36.96 ± 1.51 FT1 33.93 ± 1.33 36.00 ± 0.71 36.50 ± 0.60 36.21 ± 1.84 35.48 ± 1.28 FT2 33.13 ± 1.66 34.46 ± 0.97 34.73 ± 0.73 35.20 ± 1.92 36.48 ± 1.21 FT3 31.24 ± 0.39 32.60 ± 1.16 33.42 ± 0.65 36.74 ± 0.91 34.73 ± 0.37 FT4 29.54 ± 0.41 31.51 ± 1.04 29.82 ± 0.81 40.90 ± 0.81 36.97 ± 1.23 n: number of samples. Table VI Percentage of Moisture Content of Loose Face Powder Formulations Formulation % MC, (mean ± SD, n = 3) Freshly prepared 1 m 1 mo 2 m 2 m Ambient 45 ± 2°C Ambient 45 ± 2°C FT0 1.53 ± 0.02 1.69 ± 0.19 1.31 ± 0.08 1.41 ± 0.09 1.88 ± 0.06 FT1 3.46 ± 0.00 3.84 ± 0.21 3.81 ± 0.14 3.79 ± 0.08 4.16 ± 0.05 FT2 5.53 ± 0.01 5.97 ± 0.25 5.84 ± 0.06 6.09 ± 0.15 6.35 ± 0.04 FT3 6.61 ± 0.01 7.76 ± 0.02 8.47 ± 0.31 8.05 ± 0.09 8.41 ± 0.04 FT4 7.19 ± 0.01 9.97 ± 0.31 10.72 ± 0.19 10.14 ± 0.23 11.04 ± 0.04 n: number of samples.

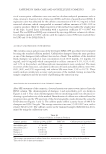
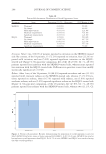
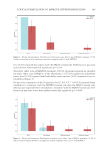
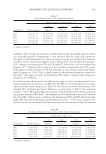
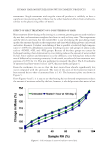
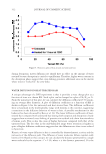
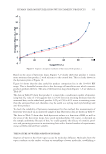
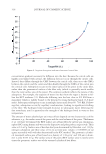
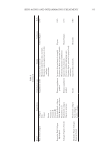
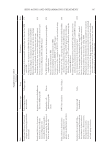
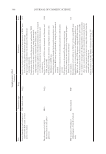
JOURNAL OF COSMETIC SCIENCE 300 of RiceSorb® affected the MC of loose face powders. This is probably due to greater sur- face areas of particles of RiceSorb® causing greater moisture absorption. Thus, adding suitable moisture absorbers are essential for the preparation process. According to Table VII, pH values of loose face powders range from 6.90 to 8.62. Overall, the pH values of freshly prepared formulations and the stored formulations were similar. The formulation FT0 (0% RiceSorb®) had higher pH than the formula- tion FT4 (80% RiceSorb®) owing to alkaline pH of talcum (see Table II). The pH was found to decrease when the proportion of RiceSorb®, which had weak acidic pH, in- creased. The pH of the formulations containing RiceSorb® is more suitable for skin application. Tes ting of insoluble substances in boiling water was another test for loose face powders based on TIS 443-2525 (11). The results are summarized in Table VIII. It was found that percent of insoluble substances in boiling water ranged from 3% to 39%. The range order of the insoluble substances in boiling water was found to be FT4 FT3 FT2 FT1 FT0. The increased proportion of RiceSorb® resulted in the increased percentage of in- soluble substances in water. The formulation FT4 provided the highest percentage, whereas the formulation FT0 gave the lowest percentage of insoluble substances in water. Under storage conditions, signifi cant changes in this parameter were obviously detected in the formulations which contained RiceSorb®, FT1 through FT4. Table VIII Percentage of Insoluble Substances in Boiling Water of Loose Face Powder Formulations Formulation Insoluble substances in boiling water (% w/w),(mean ± SD, n = 3) Freshly prepared 1 mo 1 mo 2 mo 2 mo Ambient 45 ± 2°C Ambient 45 ± 2°C FT0 5.97 ± 3.88 3.35 ± 0.78 3.35 ± 1.31 3.84 ± 1.55 4.97 ± 1.58 FT1 3.19 ± 0.15 7.81 ± 3.32 7.29 ± 1.11 7.81 ± 1.38 7.29 ± 1.11 FT2 22.34 ± 6.31 9.75 ± 5.95 20.42 ± 3.36 12.42 ± 0.91 20.42 ± 3.36 FT3 32.52 ± 2.58 25.88 ± 6.20 21.39 ± 7.65 26.88 ± 2.94 21.39 ± 7.65 FT4 38.64 ± 5.96 32.52 ± 2.13 22.52 ± 0.64 32.53 ± 2.13 22.52 ± 0.64 n: number of samples. Table VII pH of Loose Face Powder Formulations Formulation pH, (mean ± SD, n = 3) Freshly prepared 1 m 1 mo 2 m 2 mo Ambient 45 ± 2°C Ambient 45 ± 2°C FT0 8.62 ± 0.12 7.91 ± 0.09 7.53 ± 0.12 8.09 ± 0.11 7.50 ± 0.11 FT1 7.75 ± 0.07 7.69 ± 0.06 7.53 ± 0.04 7.78 ± 0.05 7.55 ± 0.06 FT2 7.67 ± 0.06 7.75 ± 0.02 7.47 ± 0.02 7.75 ± 0.05 7.54 ± 0.04 FT3 7.27 ± 0.08 7.26 ± 0.04 7.31 ± 0.04 7.35 ± 0.06 7.40 ± 0.05 FT4 6.90 ± 0.06 7.07 ± 0.03 7.22 ± 0.03 7.34 ± 0.09 7.28 ± 0.02 n: number of samples.
Purchased for the exclusive use of nofirst nolast (unknown)
From: SCC Media Library & Resource Center (library.scconline.org)