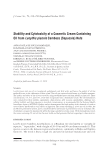
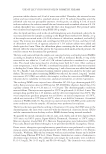
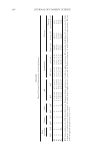
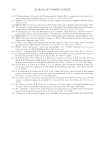
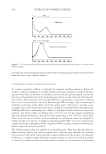
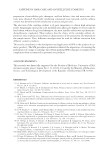
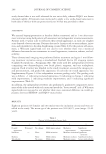
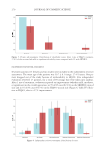
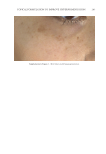
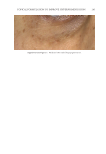
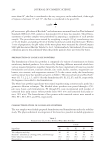
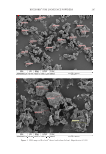
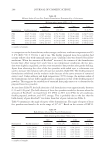
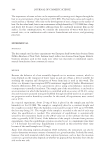
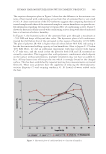
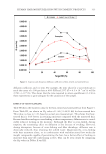
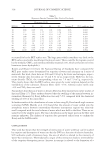
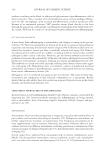
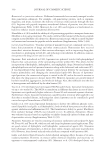
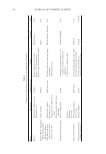
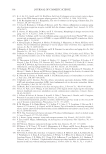
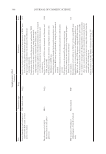
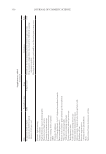
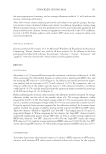
RICESORB® FOR LOOSE FACE POWDERS 297 Figure 1. SEM images of RiceSorb® (above) and talcum (below). Magnifi cation ×1,000.

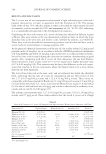
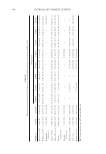
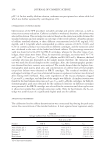
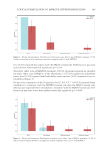
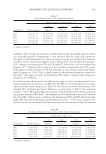
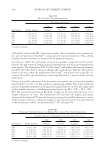
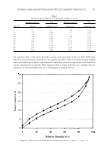
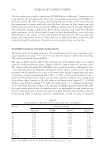
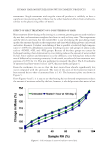
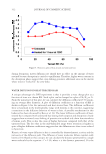
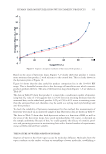
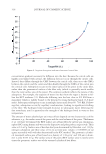
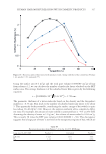
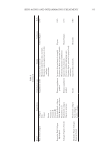
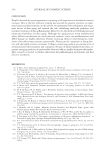
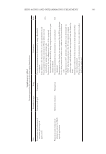
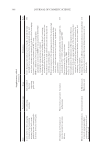
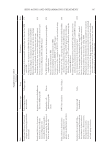
JOURNAL OF COSMETIC SCIENCE 298 in comparison to the formulations under storage conditions: ambient temperature and 45 ± 2°C (RH 75% ± 5%) for 1 and 2 mo. The freshly prepared loose face powders had creamy yellow color with tamarind extract scent. Uniform color was observed for all for- mulations. When the amounts of RiceSorb® increased, the textures of the formulations became fi ner. After storage for 1 and 2 mo at two temperature conditions, the face pow- ders were slightly coagulated, yet they were returned to fi ne powders after gentle shaking. Apart from observing the color of the face powders with naked eyes, a colorimeter was used to measure the melanin index of loose face powders (Table III). The freshly prepared formulations exhibited similar melanin index because of the same amount of tamarind extract used. Under ambient and high temperature (45°C) storage, the melanin index of the formulations did not differ signifi cantly in comparison to that of the freshly prepared powders. This suggests the suitability of tamarind fruit pulp extract as a colorant for the prepared loose face powders. As seen from Table IV, the bulk densities of all formulations were appr oximately between 0.33 and 0.49 g/ml. The bulk density of loose face powders tended to decrease when the amounts of RiceSorb® increased from 0% (FT0) to 80% w/w (FT4) for all conditions freshly prepared, ambient, and 45°C storage. This is probably due to the fact that the bulk density of pure RiceSorb® was lower than that of pure talcum (see Table I). Table V summarizes the angle of repose of fi ve formulations. The angle of repose of loose face powders was found to be in the range of 30°–41°. Based on the criteria of USP 41 Table III Melanin Index of Loose Face Powder Formulations Determined by a Colorimeter Formulation Melanin index, (mean ± SD, n = 3) Freshly prepared 1 mo 1 mo 2 mo 2 mo Ambient 45 ± 2°C Ambient 45 ± 2°C FT0 0.625 ± 0.029 0.609 ± 0.094 0.731 ± 0.092 0.725 ± 0.009 0.696 ± 0.076 FT1 0.637 ± 0.043 0.797 ± 0.094 0.792 ± 0.120 0.799 ± 0.064 0.715 ± 0.047 FT2 0.641 ± 0.033 0.739 ± 0.076 0.737 ± 0.083 0.839 ± 0.052 0.890 ± 0.070 FT3 0.676 ± 0.048 0.775 ± 0.072 0.728 ± 0.098 0.700 ± 0.072 0.828 ± 0.074 FT4 0.652 ± 0.020 0.874 ± 0.107 0.737 ± 0.119 0.736 ± 0.091 0.780 ± 0.100 n: number of samples. Table IV Bulk Density of Loose Face Powder Formulations Formulation Bulk density (g/ml), (mean ± SD, n = 3) Freshly prepared 1 mo 1 mo 2 mo 2 mo Ambient 45 ± 2°C Ambient 45 ± 2°C FT0 0.47 ± 0.00 0.49 ± 0.01 0.49 ± 0.01 0.48 ± 0.01 0.47 ± 0.00 FT1 0.43 ± 0.00 0.43 ± 0.01 0.43 ± 0.01 0.43 ± 0.00 0.42 ± 0.01 FT2 0.35 ± 0.00 0.36 ± 0.00 0.37 ± 0.01 0.39 ± 0.00 0.37 ± 0.01 FT3 0.35 ± 0.01 0.36 ± 0.00 0.35 ± 0.00 0.37 ± 0.01 0.34 ± 0.01 FT4 0.34 ± 0.01 0.35 ± 0.01 0.35 ± 0.01 0.34 ± 0.00 0.33 ± 0.00 n: number of samples.
Purchased for the exclusive use of nofirst nolast (unknown)
From: SCC Media Library & Resource Center (library.scconline.org)