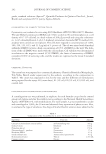
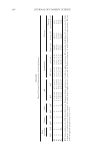
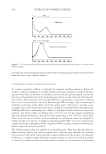
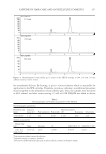
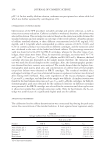
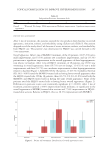
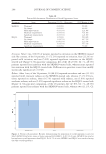
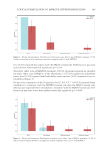
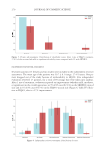
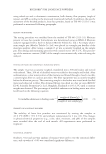
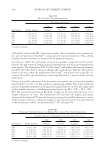
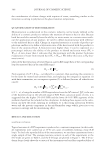
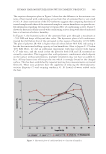
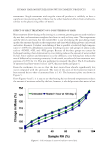
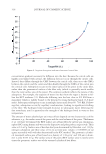
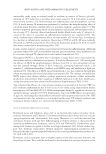
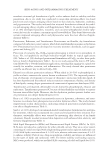
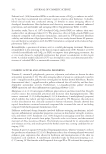
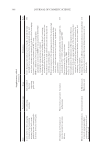
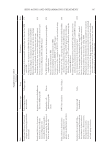
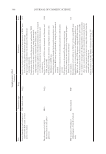
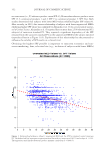
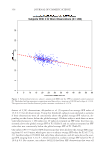
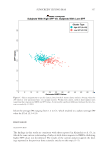
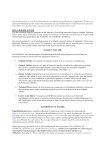
SUNSCREEN TESTING BIAS 357 below the average SPF, ranging from 1.2 to 6.5, which resulted in a subject average SPF value for P2 of 12.3 ± 2.6. DISCUSSION SELECTION BIA S The fi ndings in this study are consistent with those reported in Alejandria et al. (5), in which the same inverse relationship of subjects with lower unprotected MEDs exhibiting higher SPF values was determined. The results of the current analysis support the fi nd- ings reported in the previous three scientifi c articles on this topic (3–5). Figure 4. Su b ject assignments to specifi c clusters, based on the k-means cluster analysis. Average values for 286 subjects were partitioned into two optimal clusters. Within each cluster, subjects share similar traits regarding their unprotected MED and SPF values. A statistically signifi cant difference between the two clus- ters is revealed (p 0.001).

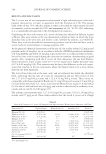
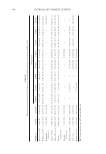
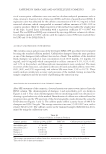
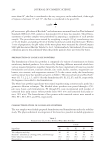
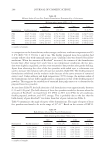
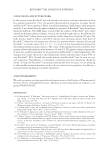
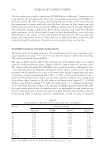
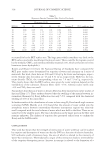
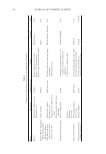
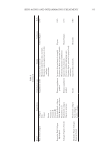
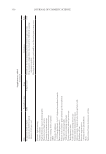
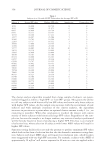
JOURNAL OF COSMETIC SCIENCE 358 The cluster a nalysis algorithm revealed that a large sample of subjects can poten- tially be flagged as either a “high SPF” or “low SPF” group. This grants the ability to cull any subjects with historically low SPF values and retain only those subjects with higher SPF values. As the sample size increases with the recruitment of new subjects and with multiple iterations of the cluster analysis, the algorithm increases in precision to a point where an optimal cluster amount is only 1 (i.e., no clustering is possible). When this conclusion is reached, the dataset will consist mainly of those subjects with historically large SPF values. Regardless of the sam- ple size, because the sample is no longer random, any statistical analysis performed will be heavily biased in favor of producing a higher SPF. This bias is an example of selection bias, where selection of subjects with lower MED values will result in higher SPF values. Sunscreen tes ting facilities face not only the pressure to produce maximum SPF values which leads to this form of selection bias but also the demand to minimize testing dura- tion. Subjects with lower MED values will require less irradiation time, which becomes more exaggerated with very high SPF sunscreens. For example, a subject with a MED of approximately 20 mJ/cm2 will receive exposure for 46 min on a test site applied with a Table I Subje cts (n = 29) with All SPF Values above the Average SPF of P2 Subject # Lowest SPF value Highest SPF value Sample size Counts above 15.6 1659 16.098 18.730 8 8 5032 16.086 21.571 6 6 6855 16.096 18.740 5 5 8141 16.111 18.737 5 5 10753 16.100 17.211 4 4 11577 16.297 23.584 5 5 20366 15.783 16.296 6 6 22203 15.717 16.312 3 3 28785 17.990 18.753 3 3 42199 16.099 20.106 4 4 53777 16.085 21.563 10 10 54633 16.116 18.060 4 4 55995 16.096 18.000 4 4 56638 16.101 16.180 4 4 60134 16.088 16.104 3 3 61257 16.119 20.114 8 8 61918 15.707 16.322 4 4 66482 16.092 18.751 3 3 68965 16.090 20.139 4 4 78620 16.113 20.356 3 3 78794 16.100 20.096 4 4 78860 16.100 16.295 7 7 80317 16.327 20.139 4 4 81248 16.286 18.770 6 6 81586 16.299 16.300 3 3 81609 18.772 20.300 3 3 81783 16.083 18.800 6 6 81840 16.110 20.116 3 3 81889 16.094 16.100 3 3
Purchased for the exclusive use of nofirst nolast (unknown)
From: SCC Media Library & Resource Center (library.scconline.org)