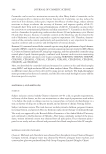
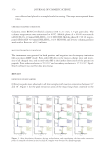
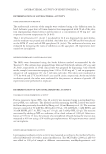
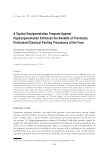
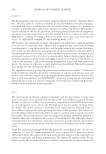
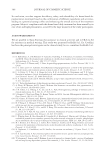
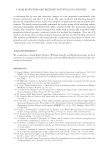
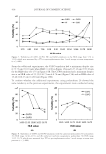
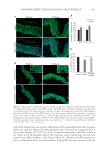
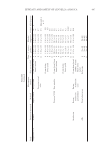
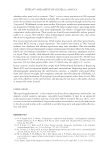
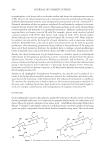
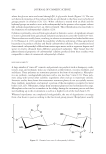
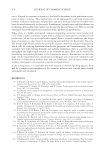
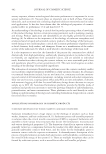
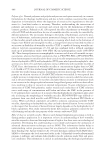
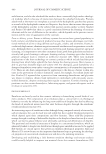
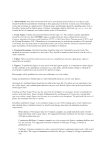
JOURNAL OF COSMETIC SCIENCE 370 was collected and placed in a sample bottle for testing. The steps were repeated three times. CHROMAT OGRAPHIC CONDITIONS Columns were BEH C18 Shield columns (100 × 2.1 mm, 1.7-μm particles). The column temperature was maintained at 40°C. Mobile phase A = 60:40 acetonitrile (ACN)/H2O + 10 mmol NH4HCO2, 0.1% HCOOH Mobile phase B = 90:10 isopro- panol (IPA)/ACN +10 mmol NH4HCO2, 0.1% HCOOH, and reverse column gradient wash with a fl ow rate of 0.3 ml/min. MASS SPECTR OMETRIC CONDITIONS The instrum ent was operated in both positive and negative ion electrospray ionization full-scan mass ddMS2 mode. First-order MS detects the mass-to-charge ratio and inten- sity of all charged ions, and second-order MS is the further dissociation of the parent ion peptide. First-order resolution is 70 × 103 and secondary resolution is 17.5 × 10³. Lipid- Search software was used for data processing. RESULTS DETECTI ON OF SK IN SAMPLES Q Exactive peak s were observed in all skin samples with reaction intensities between 105 and 107. Figure 1 list the peak extraction areas of the major long-chain ceramide in the Figure 1. After dissolution, fi ltration, drying, redissolution, and centrifuging, the fi rst-order extraction peaks of ceramide subclasses in the four skin SC samples were obtained by chromatography.

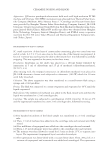
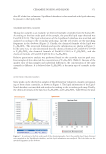
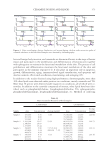
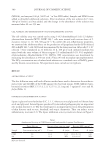
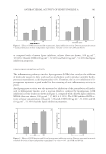
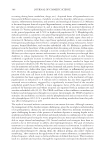
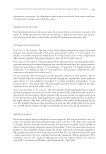
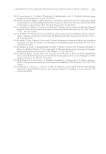
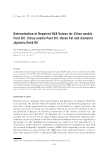
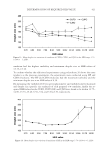
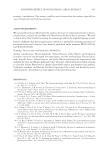
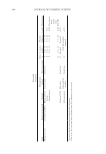
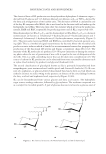
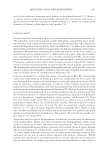
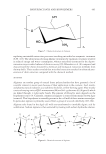
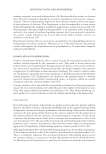
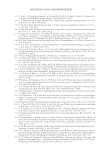
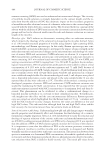
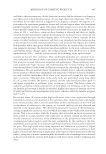
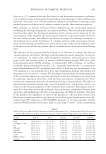
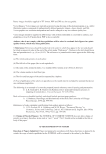
CERAMIDE IN SKIN AND BLOOD 371 skin SC of the four volunteers. LipidSearch database is then matched with lipids that may be present in the lipid profi le. CERAMIDE MATCHI NG ANALYSIS Taking skin sam ples as an example, we detected multiple ceramides from the human SC. According to the fi rst-order peak of the sample, the possible lipid type obtained was Cer(d18:0/24:0). The lipid information of the LipidSearch database was matched and analyzed according to the secondary peak map, and the red results are the matching fragments in the database (Figure 2). Finally, the chemical formula of the lipid was C42H85NO3. The structural formula and specifi c information are shown in Figure 3. In the same way, we also determined that the chemical formula of Cer(d18:0/24:0+O) is C42H85NO4, the chemical formula of Cer(d18:1/24:0) is C42H83NO3, and the chemical formula of Cer(d18:0/pO/24:0) is C42H85NO5. Relative quanti tative analysis was performed based on the ceramide reaction peak area. Four samples of skin detected the concentration of C42H85NO3 (Table I). Because of the quality error of skin samples and individual differences, the concentration of the same ceramide is different. It is believed that C42H85NO3 is the main type of ceramide in the skin. DETECTION OF BL OOD SAMPLES Some peaks can be observed in samples of blood from four volunteers, mainly correspond- ing to short-chain ceramides, as shown in Figure 4. The lipid information of the Lipid- Search database was matched and analyzed according to the secondary peak map. Finally, the chemical formula of the lipid was C20H39NO3 and C42H85NO3. Table II lists the peak Figure 2 . According to the fi rst-order peak of the chromatographic chart, the possible lipid types obtained were matched in the LipidSearch database, and the lipid information was analyzed. The red results are the matched fragments in the database.
Purchased for the exclusive use of nofirst nolast (unknown)
From: SCC Media Library & Resource Center (library.scconline.org)