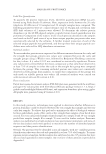
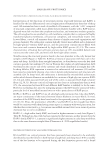
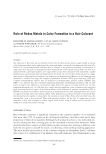
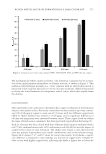
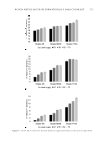
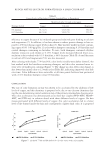
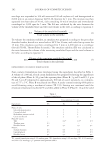
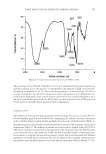
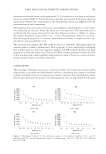
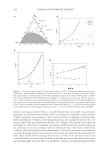
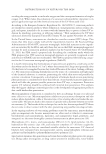
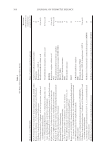
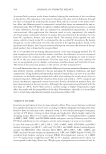
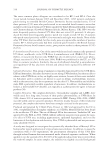
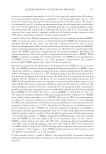
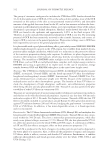
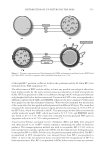
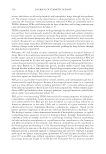
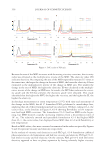
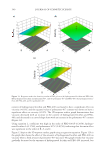
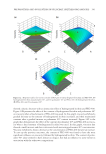
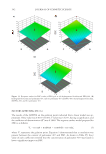
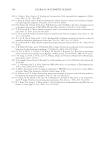
Figure 13. Response surface for DSC results of PLO gels as (A) hydrogenated lecithin and PEG-400, (B) hydrogenated lecithin and poloxamer 407, and (C) poloxamer 407 and PEG-400. (A) hydrogenated lecithin, (B) PEG-400, and (C): poloxamer 407. FACTORS AF FECTING DSC (Y3) The result s of the ANOVA on the gelation point indicated that a linear model was ap- propriate. The p value was 0.0107 ( 0.05) F value was 5.6237, having a signifi cance and the coeffi cient of determination (R2) was 0.5648. The response surface model proposed for DSC is as follows: 3 = 0.5124 + 0.0649 – 0.0047 + 0.1316C, Y A B (3) wh ere Y3 r epresents the gelation point. Equation 3 demonstrated that a correlation was present between the content of poloxamer 407 and DSC. As shown in Table VI, the p value of each coeffi cient revealed that the concentration of poloxamer 407 was found to have a signifi cant impact on DSC. JOURNAL OF COSMETIC SCIENCE 342

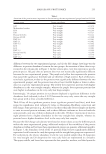
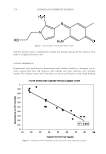
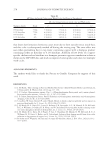
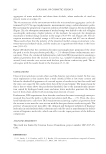
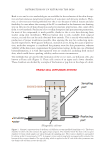
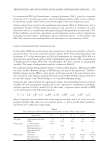
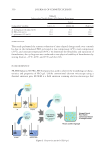
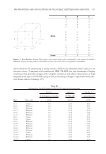
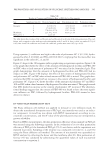
Table VII Results of Contents and Diffusion Rate of PLO Gel in Niacinamide Site Sampling time (h) Detected quantity (μg) Penetration rate (%) Permeation rate (%) Receptor 2 6.65 ± 0.72 0.30 ± 0.03 22.62 ± 3.59 4 17.06 ± 0.51 0.47 ± 0.06 8 278.09 ± 97.26 12.52 ± 4.38 Membrane 8 224.38 ± 70.74 10.10 ± 3.19 PLO gel #2–1 - 2,221.08 - - The table shows the p-values of the coeffi cients and coeffi cients of each term of the skin permeation. The coef- fi cient with a negative value indicates each relationship with 2 and 4 h, that p-value was under 0.05 (p d 0.05). But 4 and 8 h coeffi cient and 2 and 8 h coeffi cient p-value were over 0.05 (*p 0.05). Using equat ion 3, coeffi cient was high in the order of poloxamer 407 C (0.1316), hydro- genated lecithin A (0.0649), and PEG-400 B (0.0047), implying that the main effect was signifi cant in the order of C, A, and B. Figure 13 d epicts the 3D response surface graph using a regression equation. Figure 13A is the graph that shows the effect of the amounts of hydrogenated lecithin and PEG-400 on DSC when a fi xed amount of poloxamer 407 was mixed in the formulated gels. This graph demonstrates that the amounts of hydrogenated lecithin and PEG-400 had no impact on DSC. Figure 13B displays the effect of the content of hydrogenated lecithin and poloxamer 407 on DSC when a fi xed amount of PEG-400 is mixed. This graph dem- onstrates that DSC increased with an increase in the content of hydrogenated lecithin and poloxamer 407. Figure 13C shows the effect of the amounts of poloxamer 407 and PEG- 400 on DSC when a fi xed amount of hydrogenated lecithin was mixed. This graph reveals that DSC showed an increase as the content of poloxamer 407 increased. The aforemen- tioned fi ndings suggest that the content of PEG-400 was found to have the most signifi - cant infl uence on DSC, followed by hydrogenated lecithin. PEG-400 seemed to have almost no impact. IN VITRO SK IN PERMEATION TEST The Franz d iffusion cell method was applied to measure in vitro diffusion study. To obtain the transdermal absorption rate of PLO gel, niacinamide was used as an indica- tor component. A trend line was drawn with HPLC measurement according to nia- cinamide concentrations, and the R2 value of the plotted points was one interpreted as greater reliability. Based on HP LC measurements, the skin permeation effi ciency of niacinamide in PLO gel was assessed using the following equation. In the evaluation of in vitro skin permeation effi ciency of PLO gel, the formulated PLO gel (#2–1) was chosen, and the experiment was repeated four times. Sampling of the receptor was conducted over time (2, 4, and 8 h) using the Franz diffusion cell method. The amount of niacinamide was quantifi ed via HPLC analysis by collecting the donor and the membrane after 8 h. Skin permeation ef- fi ciency (%) was calculated by substituting the quantifi ed values of each niacinamide concentration to equation 4. PREPARATION AND EVALUATION OF PLURONIC LECITHIN ORGANOGELS 343
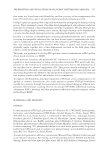
Purchased for the exclusive use of nofirst nolast (unknown)
From: SCC Media Library & Resource Center (library.scconline.org)