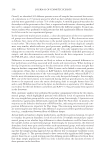
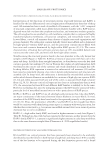
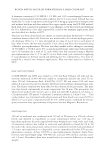
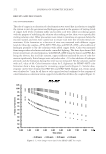
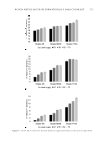
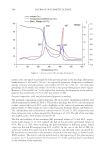
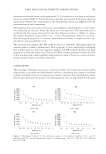
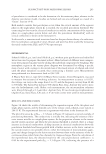
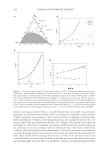
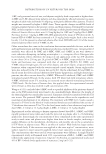
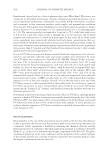
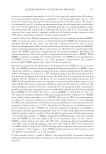
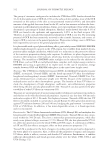
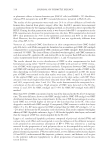
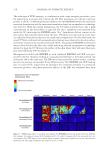
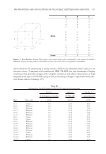
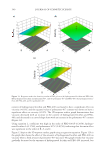
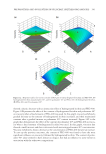
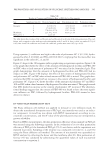
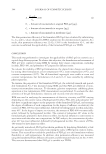
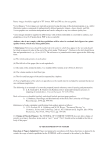
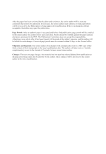
content of hydrogenated lecithin and PEG-400 was found to have a signifi cant effect on viscosity ( 0.05), and the squared value of poloxamer 407 content was shown to have a signifi cant effect on viscosity ( 0.05). The 3D response surface graph demonstrates that viscosity decreased with an increase in the content of hydrogenated lecithin and PEG- 400, and decreased in a curved-shape form with an increase in the poloxamer 407 content (Figure 12). Using equa tion 2, coeffi cient was high in the order of PEG-400 B (0.2050), hydroge- nated lecithin A (0.1748), and poloxamer 407 C (0.0358), indicating that the main effect was signifi cant in the order of B, A, and C. Figure 12 depicts the 3D response surface graph using a regression equation. Figure 12A is the graph that shows the effect of the amounts of hydrogenated lecithin and PEG-400 on viscosity when a fi xed amount of poloxamer 407 was used. This graph reveals that viscosity gradually decreased as the amounts of hydrogenated lecithin and PEG-400 increased, but Figure 11. Response surface for elasticity results of PLO gels as a (A) hydrogenated lecithin and PEG-400, (B) hydrogenated lecithin and poloxamer 407, and (C) poloxamer 407 and PEG-400. (A) hydrogenated leci- thin, (B) PEG-400, and (C) poloxamer 407. JOURNAL OF COSMETIC SCIENCE 340

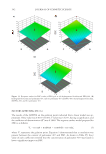
showed a drastic decrease with an interaction effect of hydrogenated lecithin and PEG-400. Figure 12B presents the effect of the content of hydrogenated lecithin and poloxamer 407 on viscosity when a fi xed amount of PEG-400 was used. In this graph, viscosity exhibited a gradual decrease as the amount of hydrogenated lecithin increased, and then maintained constant after a gradual increase as poloxamer 407 content increased. Figure 12C is the graph that demonstrates the effect of the content of poloxamer 407 and PEG-400 on viscos- ity when a fi xed amount of hydrogenated lecithin was used. In this graph, viscosity fi rst showed a small increase and then it decreased with increasing poloxamer 407 concentration. Viscosity exhibited a drastic decrease as the concentration of PEG-400 showed an increase. To sum up the previous outcomes, the content of PEG-400 was found to have the most signifi cant infl uence on viscosity, followed by hydrogenated lecithin. The content of polox- amer 407 alone seemed to have almost no impact, but had an infl uence to some extent in association with the other two compositions. Figure 12. Response surface for viscosity results of PLO gels as (A) hydrogenated lecithin and PEG-400, (B) hydrogenated lecithin and poloxamer 407, and (C) poloxamer 407 and PEG-400. (A) hydrogenated lecithin, (B) PEG-400, and (C) poloxamer 407. PREPARATION AND EVALUATION OF PLURONIC LECITHIN ORGANOGELS 341
Purchased for the exclusive use of nofirst nolast (unknown)
From: SCC Media Library & Resource Center (library.scconline.org)