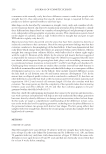
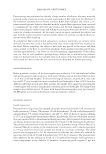
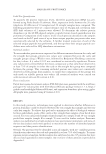
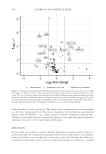
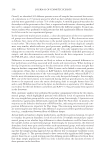
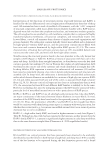
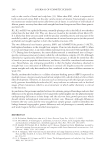
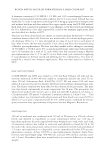
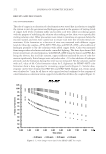
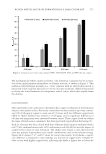
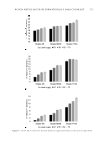
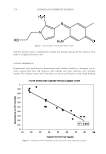
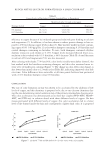
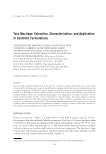
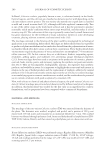
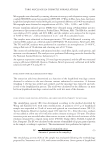
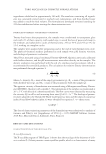
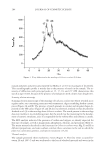
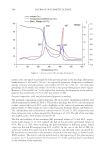
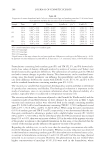
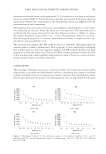
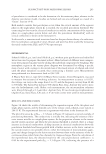
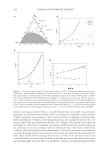
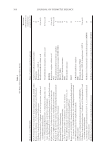
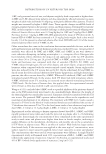
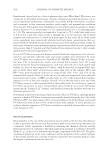
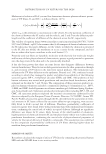
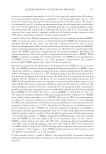
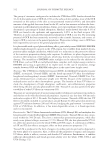
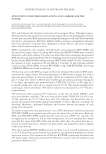
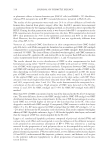
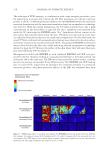
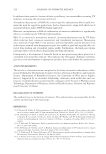
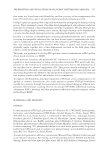
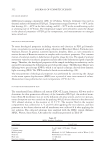
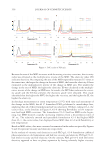
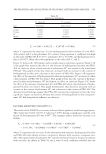
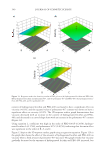
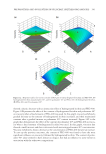
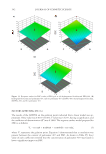
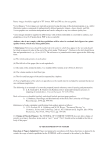
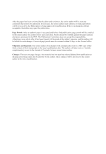
Because the area of the MSD increases with decreasing viscosity over time, the viscosity index was obtained as the multiplicative inverse of the MSD. The elasticity index (EI) indicates elasticity. By comparing the area of the MSD repeatedly measured 15 times at the same time, the larger the change in the area of MSD, the lower the elasticity. EI was estimated as the multiplicative inverse of the change in MSD area. The smaller the change in the area of MSD, the higher the elasticity EI was calculated as the multipli- cative inverse of the change in MSD area. As results, the MVI that indicates the viscos- ity grade and the EI that presents the elasticity grade were obtained. This study identifi ed that the higher the MVI, the higher the viscosity, and the higher the EI, the higher the elasticity. In rhe ology measurement at room temperature (25°C) with time and assessment of the change in the MSD, the all 17 formulated PLO gel showed a curved-shape line, implying that all of these formulations had viscoelasticity. Of these, taking #2–1, the center value, as the baseline in Figure 8, #2–6 showing fl owability at low tempera- ture had high MSD over time. The formulation #2–12 had low MSD in the begin- ning, but MSD showed a rapidly increasing tendency from a decorrelation time of 102 sec. The relatively smooth and spreadable formulation #2–3 had higher MSD than #2–1, the center value, but displayed lower MSD than #2–6 with fl owability at low temperature. Based o n MSD values, data were converted to numerical index values reciprocally. Figures 9 and 10 represent viscosity and elasticity, respectively. In the analysis of viscosity and elasticity in each PLO gel, #2–6 formulation exhibited phase separation at cold temperature and had low viscosity and elasticity. PLO gel #2–11 had lowest viscosity and low elasticity. On the contrary, PLO gel #2–2 with the lowest elasticity appeared to have no phase separation by having relatively higher viscosity. Figure 7. DSC results of PLO gels. JOURNAL OF COSMETIC SCIENCE 336

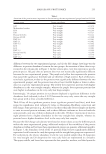
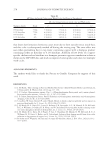
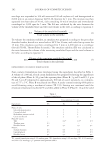
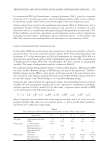
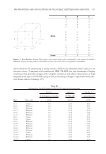
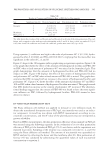
These fi ndings imply that viscosity has more signifi cant infl uence on formulation stabil- ity at low temperature than elasticity. RSM RES ULT Table V shows the data for response variables by independent variables according to the experimental design used in this study. Analysis of variance (ANOVA) was used in determin- ing the most appropriate response surface model for the effect of independent variables. Using this response surface model, the changes in response variables including viscosity, elasticity, and DSC (mW/mg) at a gelation point of –10°C were estimated by the concen- trations of poloxamer 407, hydrogenated lecithin, and PEG-400 as independent variables. Table VI represents an adequate model according to the results of the ANOVA. Interactive coeffi cients and p values represent the effect of independent variables on response variables in the model. The 3D response surface graphs (Figures 11–13) are used in interpreting the Figure 8. Visco-elasticity results of PLO gels. Figure 9. Viscosity results of PLO gels. PREPARATION AND EVALUATION OF PLURONIC LECITHIN ORGANOGELS 337
Purchased for the exclusive use of nofirst nolast (unknown)
From: SCC Media Library & Resource Center (library.scconline.org)