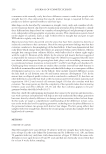
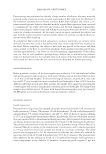
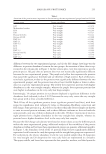
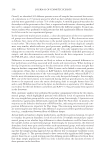
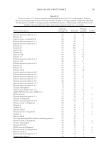
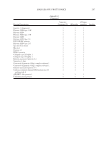
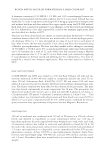
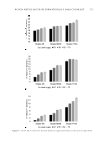
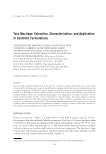
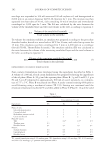
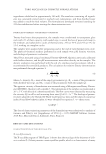
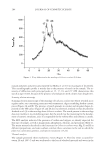
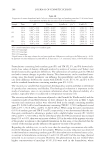
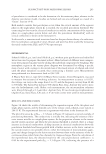
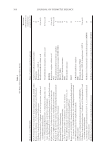
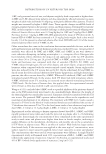
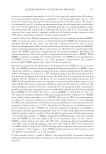
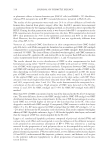
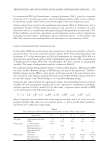
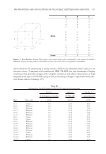
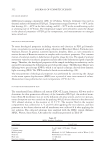
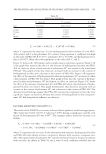
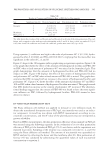
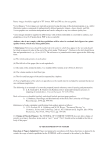
signifi cant impact of independent variables on response variables in the response surface model (33). FACTORS AFFECTING ELASTICITY (Y1) The resu lts of the ANOVA on elasticity indicated that a linear model was appropriate. The p value was 0.0040 ( 0.05) F value was 7.3545, having a signifi cance and the coef- fi cient of determination (R2) was 0.6292. The response surface model for elasticity is as follows: Figure 10. Elasticity results of PLO gels. Table V Box-Behnken Design Experiments for PLO Gel Optimization Run Space type Factor 1 Factor 2 Factor 3 Response 1 Response 2 Response 3 A: Hydrogenated lecithin B: PEG- 400 C: Poloxamer 407 Elasticity Viscosity DSC wt% wt% wt% EI (1/nm2) MVI (1/nm2) mW/mg #2–1 Center 3.0 20.0 20.0 0.3511 0.6300 0.53319 #2–2 IB factor 1.0 25.0 20.0 0.1555 0.7539 0.47859 #2–3 IB factor 5.0 20.0 15.0 0.6021 0.4382 0.44563 #2–4 IB factor 5.0 15.0 20.0 0.8769 0.6585 0.37812 #2–5 IB factor 3.0 25.0 15.0 0.3936 0.4468 0.36887 #2–6 IB factor 1.0 20.0 15.0 0.1801 0.3688 0.24754 #2–7 Center 3.0 20.0 20.0 0.7743 0.6874 0.53816 #2–8 Center 3.0 20.0 20.0 0.3804 0.7676 0.54413 #2–9 IB factor 3.0 25.0 25.0 0.7060 0.7417 0.63741 #2–10 IB factor 1.0 25.0 25.0 0.6160 0.8087 0.50225 #2–11 IB factor 3.0 15.0 15.0 0.5406 0.3230 0.38335 #2–12 IB factor 3.0 25.0 25.0 0.5591 0.7662 0.47410 #2–13 IB factor 5.0 20.0 20.0 0.2696 0.3910 0.59556 #2–14 Center 3.0 20.0 20.0 0.4471 0.6925 0.55291 #2–15 IB factor 5.0 25.0 25.0 0.5036 0.4329 0.88435 #2–16 IB factor 1.0 20.0 20.0 0.6652 1.3879 0.55577 #2–17 Center 3.0 20.0 20.0 0.6547 0.7400 0.59108 JOURNAL OF COSMETIC SCIENCE 338

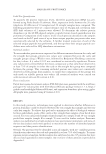
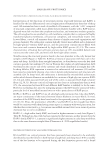
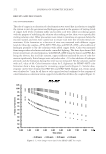
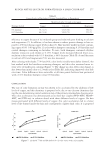
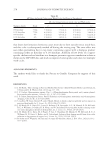
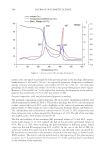
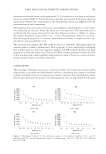
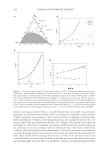
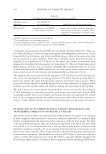
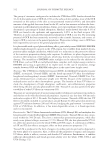
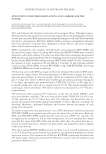
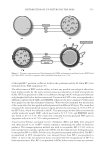
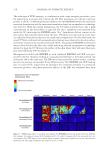
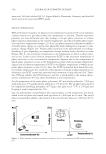
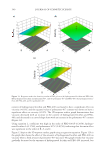
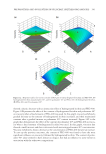
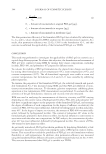
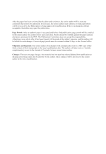
1 = 0.5103 + 0.0527 – 0.2077 + 0.0789 , Y A B C (1) wh ere Y1 represents the elasticity, A is the hydrogenated lecithin content, B is the PEG- 400 content, and C is the poloxamer 407 content. Using equation 1, coeffi cient was high in the order of PEG-400 B (0.2077), poloxamer 407 C (0.0789), and hydrogenated leci- thin A (0.0527). Main effect was signifi cant in the order of B, C, and A. Figure 11 depicts the 3D response surface graph using a regression equation. Figure 11A is the graph that presents the effect of the amounts of hydrogenated lecithin and PEG- 400 on elasticity when a fi xed amount of poloxamer 407 was mixed in the formulated PLO gel. This graph reveals that elasticity increased with an increase in the content of hydrogenated lecithin and a decrease in the content of PEG-400. Figure 11B represents the effect of the amounts of hydrogenated lecithin and poloxamer 407 on elasticity when a fi xed amount of PEG-400 was mixed. This graph reveals that the content of hydroge- nated lecithin and poloxamer 407 had almost no effect on elasticity. Figure 11C shows the effect of the amounts of poloxamer 407 and PEG-400 when a fi xed amount of hydro- genated lecithin was mixed. This graph demonstrates that elasticity increased with an increase in the content of poloxamer 407 and a decrease in the content of PEG-400. The aforementioned fi ndings suggest that PEG-400 concentration appeared to have the most signifi cant impact on elasticity, whereas the content of hydrogenated lecithin and polox- amer 407 had insignifi cant infl uence on elasticity. FACTORS A FFECTING VISCOSITY (Y2) The resul ts of the ANOVA on viscosity indicated that a quadratic model was appropriate. The p value was 0.0215 ( 0.05) F value was 5.0995, having a signifi cance and the coef- fi cient of determination (R2) was 0.8677. The response surface model for viscosity is as follows: 2 2 2 2 = 0.7035– 0.1748 – 0.2050 + 0.0358 + 0.0916 – 0.1113 – 0.0248 + 0.0186 + 0.0758 – 0.2099 , Y A B C AB AC BC A B C (2) wher e Y 2 re presents the viscosity. In the aforementioned equation, hydrogenated lecithin and PEG-400 were shown to have a reciprocity relation with viscosity, a response vari- able. The squared value of poloxamer 407 content was found to have a reciprocity relation with viscosity. As shown in Table VI, the p value of each coeffi cient revealed that the Table VI ANOVA for RSM Model Run Y1, elasticity Y2, viscosity Y3, DSC EI (1/nm2) MVI (1/nm2) mW/mg p-value 0.0040 0.0215 0.0107 F-value 7.3545 5.0995 5.6237 R2 0.6292 0.8677 0.5648 Model Linear Quadratic Linear PREPARATION AND EVALUATION OF PLURONIC LECITHIN ORGANOGELS 339
Purchased for the exclusive use of nofirst nolast (unknown)
From: SCC Media Library & Resource Center (library.scconline.org)