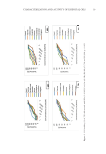
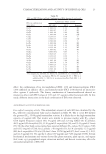
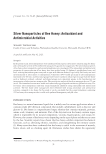
35 Silver Nanoparticles of Bee Honey RESULTS AND DISCUSSION PHYSICOCHEMICAL PARAMETERS OF BEE HONEY The physicochemical analysis of the study bee honey generally indicated water content, an acidic pH, and electrical conductivity values of 14.6%, 4.38, and 0.5 µs/cm respectively. Samples A, B, and C were bee honey from longan flowers, wildflowers, and benjaphan flowers, respectively. The physicochemical parameters of A, B, and C bee honey are shown in Table II. BIOSYNTHESIS OF AgNPs In the current work, silver nanoparticles were successfully synthesized with bee honey. The reaction mixture was observed for the change in color after the incubation period. No color change was observed in the control flask containing only bee honey without 1 mM AgNO 3 ,kept under the same conditions (Figure 1a), whereas the contents of the experimental flask turned completely brown (Figure 1b). As the biosynthesis proceeded, the reduction of silver ions continued, and the color changed gradually from light yellow to dark brown within 8 hours (Figure 1b). This brown coloration could be due to the surface plasmon vibrations of silver nanoparticles formed in the reaction mixture (12). CHARACTERIZATION BY UV-VISIBLE SPECTROSCOPY The biosynthesized AgNPs–bee honey nanoparticles were characterized at different incubation periods using UV-visible spectrophotometer. At different periods of incubation, Table I Compositions and Concentrations of Ingredients in Serum Formulations Ingredient Formulation (g) F0 F1 F2 F3 F4 Xanthan gum 0.25 0.5 1.0 1.5 2.0 Deionized water 96.4 95.9 92.9 89.9 86.9 Bee honey/AgNPs–bee honey 2.0 1.0 2.0 3.0 4.0 Glycerin 1.0 2.0 3.0 4.0 5.0 Methyl paraben 0.1 0.1 0.1 0.1 0.1 Tween 80 0.125 0.25 0.5 0.75 1.0 Poly(ethylene glycol) 0.125 0.25 0.5 0.75 1.0 Table II Physicochemical Parameters of Bee Honey Samples Bee honey sample origin Water content (%)pH Electrical conductivity (μS/cm) Longan flowers 14.05 ± 1.02 5.05 0.55 ± 0.08 Wildflowers 15.22 ± 0.98 4.48 0.52 ± 0.08 Benjaphan flowers 15.69 ± 0.25 4.39 0.47 ± 0.06

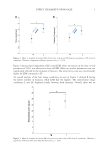
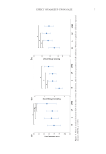
36 JOURNAL OF COSMETIC SCIENCE a broad spectral peak was observed at 500 nm (Figure 2). The results obtained from the UV-visible spectra suggested the formation of AgNPs–bee honey nanoparticles. FTIR ANALYSIS Only naturally obtained bee honey has been used to characterize the spectroscopic properties. Typically, the characteristic differences in the FTIR spectral analysis for bee honey and AgNPs–bee honey nanoparticles were observed (Figure 3). The O-H stretching vibration band is very broad and occurs in the field of 3,400 to 3,000 cm−1 with the maximum at 3,285 cm−1. This is the same area as the stretching vibration region for carbon and aromatic C-H groups. The O-H bending can appear in 1,418 to 1,339 cm−1 and 1,026 cm−1. The stretching vibration band of the C-O stretching occurs at 1,646 cm−1. The exact position of the band depends on whether the acid is saturated Figure 1. Visual observation of silver nanoparticles formation: (a) bee honey and (b) AgNPs–bee honey nanoparticles. Figure 2. UV-visible spectra of AgNPs–bee honey nanoparticles biosynthesis at different times of incubation.
Purchased for the exclusive use of nofirst nolast (unknown)
From: SCC Media Library & Resource Center (library.scconline.org)