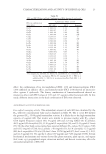
Table III Skin Hydration, TEWL, and pH (Average ± SD) Before and After the Application of Different ABHS (F#1 to F#9 and Benchmark) a Hydration (a.u.) TEWL (g/m²/h) pH Formulation Baseline Application p value Baseline Application p value Baseline Application p value Volunteer number F#1 35.22 ± 7.81 49.62 ± 13.33 ***9.57 ± 1.89 7.26 ± 1.46 ***5.58 ± 0.48 4.93 ± 0.22 ***10 F#2 37.48 ± 8.82 41.1 ± 7.22 **10.45 ± 2.62 8.01 ± 2.18 ***5.37 ± 0.46 4.86 ± 0.24 ***10 F#3 32.85 ± 6.63 34.95 ± 6.15 *10.91 ± 2.43 8.81 ± 2.04 ***5.45 ± 0.45 4.83 ± 0.3 ***9 F#4 40.48 ± 6.9 44.01 ± 5.97 ***9.79 ± 1.99 8.14 ± 1.85 **5.26 ± 0.5 4.44 ± 0.18 ***9 F#5 37.93 ± 5.43 45.75 ± 5.58 ***10.06 ± 2.1 8.3 ± 1.97 ***5.35 ± 0.44 4.55 ± 0.2 ***10 F#6 34.43 ± 7.27 37.05 ± 8.24 **11.02 ± 2.19 9.19 ± 2.48 **5.25 ± 0.33 4.75 ± 0.23 ***10 F#7 40.42 ± 5.43 43.02 ± 7 NS 9.76 ± 1.44 9.2 ± 1.13 NS 5.6 ± 0.36 4.55 ± 0.29 ***5 F#8 35.94 ± 6.75 40.65 ± 6.51 ***10.04 ± 1.63 7.49 ± 1.31 ***5.4 ± 0.43 5.73 ± 0.23 ***13 Benchmark 37.05 ± 6.43 37.24 ± 7.78 NS 10.28 ± 2 7.63 ± 1.59 ***5.4 ± 0.44 5.83 ± 0.22 ***13 a Corresponding p value (paired t-test or Wilcoxon signed-rank test, according to data normality). *0.05 **p 0.01 ***p 0.001 NS means there were no significant differences (0.05). 52 JOURNAL OF COSMETIC SCIENCE

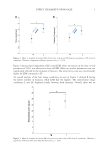
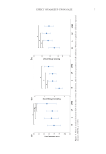
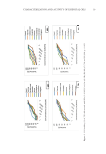
53 MULTIDISCIPLINARY PROCESS OF HAND SANITIZER means higher measured hydration (23). TEWL was evaluated with a Tewameter® TM Hex probe (Courage and Khazaka, Cologne, Germany), which uses an open-chamber method to measure the density gradient of the water evaporation from the skin this is proportional to the TEWL (24). TEWL should be as low as possible in healthy skin, as lower values correlate with less water loss and better barrier function (25). Skin pH was measured with a Skin-pH- meter PH 905 probe (Courage and Khazaka, Cologne, Germany), which is a measurement electrode that allows direct contact with the skin via a flat glass membrane on the tip of the probe (26). Usually, human skin pH ranges between 4 and 6 and plays a vital role in keeping the stratum corneum barrier function and resident microbiota healthy (27). Small-scale consumer evaluations were performed in parallel with the skin parameters’ evaluations. A consumer evaluation is the process of assessing the properties or performance of existing or new products or services as perceived by consumers (28). During the product development process, these evaluations are important in aligning the product’s characteristics as much as possible with consumers’ preferences and insuring its acceptance (29). Although ABHS F#1 was more hydrating than F#2, it also had a significantly worse sensorial evaluation (Figure 2). The sensorial evaluation was conducted on a scale from dislike (0–4) to like (6–9). Therefore, the higher the value given to the attribute, the better the evaluation. Considering this, F#2 was selected as the base formulation to go forward for further improvement, because product development should not be exclusively guided by pure effectiveness it should also be guided by sensorial acceptance (29). Improvement of moisturizing capacity. To raise ABHS F#2’s moisturizing capability, the concentration of squalane and glycerin was increased. Squalane is a colorless and odorless hydrocarbon oil, with good physical and chemical stability resulting from its hydrogenation (30). Squalene was originally found in shark livers, but it can currently be obtained from renewable and environmentally friendly sources, such as olives and sugarcane, and it can also be produced by fermentation using engineered yeast strains (30,31). In addition, squalene is also naturally present in the lipid layers of the skin, which makes squalane, its saturated derivative, an excellent moisturizer for topical applications (30,32). Several attempts were made to increase the squalane concentration (data not shown), but the oil phase separated from the formulation. To improve this, the concentration of emulsifier was performed, which originated with formulation F#3, to avoid the oil phase splitting over time. Improvement of hydration capacity. Formulations F#4 and F#5 were created, with increasing concentrations of glycerin, and tested on volunteers. Glycerin, which is also referred to as Figure 2. Radar charts of different ABHS prototypes [A) F#1 vs F#2 B) F#3 vs F#4 vs F#5 C) F#3 vs F#6 vs F#7] for the studied sensory attributes. *p 0.05 **p 0.01 ***p 0.001 NS means there were no significant differences (p 0.05).
Purchased for the exclusive use of nofirst nolast (unknown)
From: SCC Media Library & Resource Center (library.scconline.org)