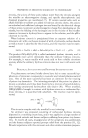
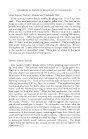
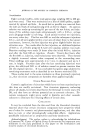
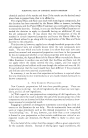
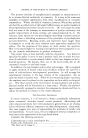
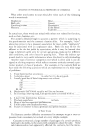
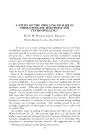
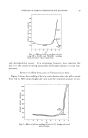
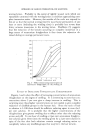
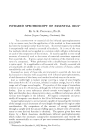
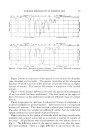
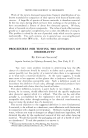
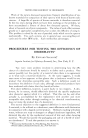
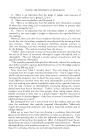
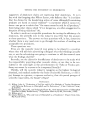
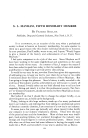
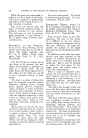
102 JOURNAL OF THE SOCIETY OF COSMETIC CHEMISTS Absorptions in the infrared are due to vibrations within the molecule of absorbing material, these absorptions being of the same frequency as the vibrations causing them, or overtones of these frequencies, or combinations of them. Each structural group of a molecule is free to vibrate in only a very limited number of ways and therefore can cause only a limited number of absorption bands in the infrared. The position of these bands is not absolutely fixed, but may be slightly altered by the rest of the molecule. This is a disadvantage in that it makes the correlation of absorption bands with chemical structuremore di•cult in some cases, but it has the advantage of yielding some information about the structural portion of a molecule which is not directly responsible for the band being considered. Some of the stronger bands are easily recognized by their shape and position. Thus we find that all alcohols show absorption in the vicinity of 3.0 microns, and in the region of 7.0 to 10.0 microns have bands which distinguish between primary, secondary, and tertiary alcohols. All carbon-hydrogen groups absorb in the neighborhood of 3.4 microns, the exact region depending upon whether there are one, two, or three hydrogen atoms attached to the carbon atom. Two other absorption bands of these groups appear at approxi- mately 6.8 and 7.2 microns. The carbonyl group, common to a]dehydes, ke- tones, esters, and carboxylic acids, causes a strong, sharp absorption band usually lying between 5.8 and 6.0 microns. Each of these four classes of compounds has other distinctive bands which serve to identify it. Also, many acid radicals of esters have easily recognized patterns of absorption bands. Aromatic ethers may be detected by bands at 8.0 and 9.7 microns, WAVE NUMBERS IN CM4 WAVE NUMBERS IN Ck, fl S000 4OO0 *•000 2•O0 500 400 100 200 O0 0O0 BOO IO0 7OO 2 MICRONS 0 II WAVEI2LENGTH IN I•ICRON$ 14 I$ Figure 1.--3.0 and 9.5 microns, OH bands of phenyl ethyl alcohol 3.4 microns, carbon- hydrogen bands of aldehyde C-11 3.7 microns, aldehyde band of aldehyde C-11 4.5 microns, --C•C-- band of methyl heptine carbonate * 5.8 microns, carbonyl band of aldehyde C-11 6.1 microns, C=C band of aldehyde •-11 6.7 and 6.9 microns, benzyl group ofphenyl ethyl alcohol 7.2 and 7.4 microns, CHa--C--CHa band of menthol 8.05 microns, ether band of anisole 11.3 microns, •CH2 band oflimonene 14.1 and 14.7 microns, cinnamate bands of methyl cinnamate 14.4 microns, phenyl band of phenyl ethyl alcohol and 14.4 and 14.7 microns, salicylate bands of methyl salicylate. * Author's note: The absorption band at approximately 4.5 microns in Fig. 1 attributed to the triple bond of methyl heptine carbonate is really due to the group --C•C--C•-----O.

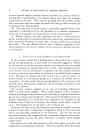
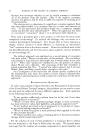
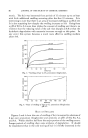
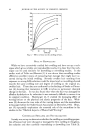
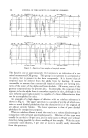
INFRARED SPECTROSCOPY OF ESSENTIAL OILS 103 and aliphatic ethers show absorption at approximately 9.0 microns. Double bonds between carbon atoms cause a band at 6.1 microns, but if these are conjugated double bonds, the band is shifted to a slightly longer wave- length. The unsaturated terminal =CH2 group is responsible for an addi- tional band at about 11.3 microns which is frequently useful. The presence or absence of this band may be decisive in determining which of two possible structures of a terpene is the correct one. Triple bonds cause a sharp, strong band at about 4.5 microns. Figure 1 is a composite curve designed to show what some of the prominent, easily interpretable bands look like. All curves show absorption of 0.1-min. layers of 10% solutions in carbon tetrachloride. Other bands show the number and position of substituents on the ben- zene ring. Cis-trans isomers and even stereoisomers may be distinguished by means of infrared absorption spectra. A few simple aliphatic groups such as the isopropyl and the tertiary butyl group are readily detected. A great many other correlations have been worked out, but they are pri- marily of interest in fields other than essential oils. Since the correlation between chemical structure and infrared absorp- tion exists, it follows that each chemical compound will have its own unique spectrum by which it may be identified as certainly as a man may be identi- •VA','E NUMEERS lU CM' WAVE NUMBERS I• •o• 40 - 0 WAVE LENGTH IN MICRONS WAVE LENGTH IN MICRONS WAVE NOMEERS IN CM-I WAVE NUMBERS IN CM I [ io i $m iN i icloNs i i i WAY
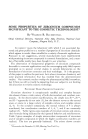
Purchased for the exclusive use of nofirst nolast (unknown)
From: SCC Media Library & Resource Center (library.scconline.org)