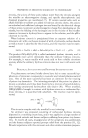
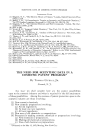
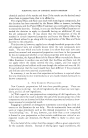
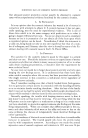
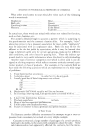
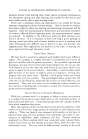
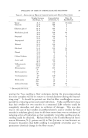
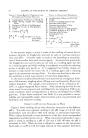
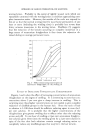
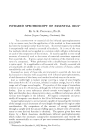
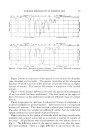
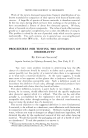
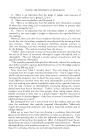
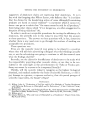
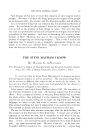
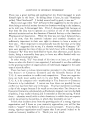
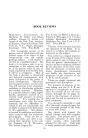
104 JOURNAL OF THE SOCIETY OF COSMETIC CHEMISTS fled by his fingerprints. It should be noted that in some cases higher homo- logues of a series may have spectra so similar to each other as not to be dis- tinguishable in the 2.0 to 16.0 micron region. For example, the spectra of palmitic and stearic acids appear identical. At longer wave lengths, where absorption is determined by molecular rotation, it should be possible to distinguish them. The ability of infrared spectrophotometry to show the identity of sub- stances constitutes one of its most useful applications to essential oils. In the case of pure chemicals it readily establishes identity. However, the odor value of such a material may depend upon the absence of relatively minute amounts of impurities. These are usually overlooked by this method, and therefore the nose is a better judge of quality of a chemical which is known to be essentially pure. When the spectrum of a mixture of materials is derived, all of the absorp- tion bands of all of the constituents appear. Of course, the intensity of the individual bands is dependent upon the relative concentration of the ma- terial responsible for them. Thus it is possible to identify mixtures, such as naturally occurring oils, and to check their constancy of composition from sample to sample. In a similar manner it is usually very easy to detect adulteration or dilution of an oil. WAVE NUI,•BEI•S IN CM' WAVE NUMBERS IN CM• 50OO 4000 3000 2S0O 2000 IS00 1400 1300 1200 II00 1000 900 •n• i0o •-. TM 625 0 WAV LENGTH IN MICRONS WAVE LENGTH iN MICRONS WAVE NUMBERS iN CM, WAVE NUMBERS iN C:M I $o0o 4o0o 3000 •s• zoee isoo 14oo 130o iz0o Hoo iooo 90o 700 poo I , a, J i II'l II1[1111 ' ] i,• , r ...... i, i illill I , 6ZS •0 ] Io 4 S 6 7 8 e •0 •1 12 I• 14 IS WAVE LEN•aTH JN MICRONS WAVE LEN•aTH IN MICRONS Figure &--Upper curve: Spectrum of pure bergamot oil. Lower curve: Spectrum of adulter- ated bergamot oil.

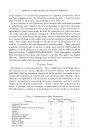
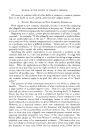
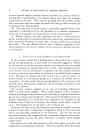
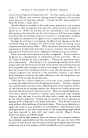
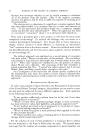
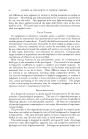
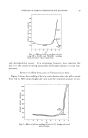
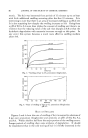
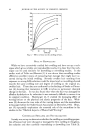
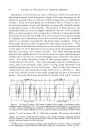
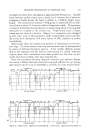
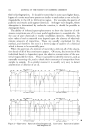
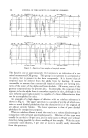
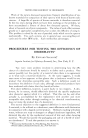
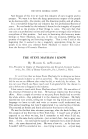
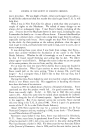
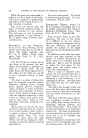
INFRARED SPECTROSCOPY OF ESSENTIAL OILS 105 WAVE NUMBERS •N CM• W•,VE NUMBERS IN WAVE LENGTH I MICRONS WAVE LENGTH IN MICRONS WAVE NUMBERS sooo 4000 3000 3s00 B00o __ IN CM, WAVE NUMBERS IN ½u I isoo L400 1300 1200 1100 1000 9o0 7• 625 i o 4 7 a 9 l0 I• 12 I• •4 IS WAVE LENGTH iN MICRONS WAVE LENGTH •N MtCRONS Figure 4.--Upper curve: Spectrum ofgeranyl formate. Lower curve: Spectrum of material mislabeled as geranyl formate. Figure 2 shows a comparison of the spectra of two natural oils of similar type, lavender and lavandin. The greater intensities of the absorption bands at 5.8 and 8.1 microns in the spectrum of lavender indicate its higher content of acetate. The band at 9.0 microns is a measure of the ]ina]ool content. Figure 3 shows distinct differences between the spectra of real bergamot oil and one which has been adulterated. The ester bands in the region of 8.0 to 9.0 microns in the adulterated sample are definitely those of terpinyl acetate. Figure 4 represents the spectrum of real geranyl formate as compared to a material mislabeled as geranyl formate. All formates have a strong band at about 8.5 microns. The other material is almost pure terpinyl acetate. The odors of these two samples are sufficiently similar that the mislabeled sample could pass as a poor grade of geranyl formate. Slight variations in the spectra of materials which had been considerably extended with terpinyl acetate led us to examine a number of samples of this ester. All gradations were found between the two spectra shown in Fig. 5. The difference noted in the spectra persists even after the esters have been purified. There is a slight difference in odor between the two.
Purchased for the exclusive use of nofirst nolast (unknown)
From: SCC Media Library & Resource Center (library.scconline.org)