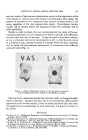
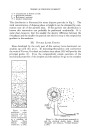
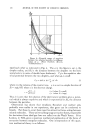
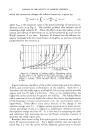
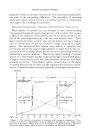
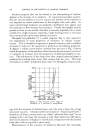
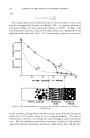
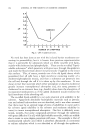
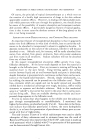
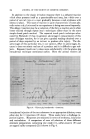
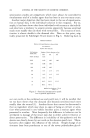
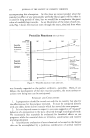
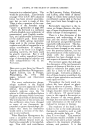
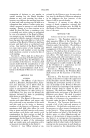
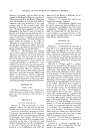
190 JOURNAL OF THE SOCIETY OF COSMETIC CHEMISTS and 7 -- 6k' Lo/w = 2 X 10 a__ 7+3// The values chosen here as illustration are not far from those of two actual liquids investigated by Eucken and Becker (10): an aqueous solution of potassium iodide and water-saturated phenol, at 19.6øC. In Fig. 3 the two theoretical equations, indicated by dotted lines, are compared with the experimentally observed values. It is interesting to observe an inversion 0.0020 0.0015 0.0010 • 0.000 5 20 40 I 60 80 I00 i i VOLUI•!E PERCENT OF PHENOL I • I I I ß PHENOL IN WATER • INVERSION •, WATER IN ZONE PHENOL Figure &--The specific conductivity of aqueous KI and phenol emulsions as a function of composition. of the emulsion, during which the observations move from the theoretical values for an o/w type to those for a w/o type of emulsion. It is also of interest that inversion is not abrupt but exists through a zone of concentra- tion. But the significant result from our present viewpoint is the excellent agreement between experiment and theory which shows how well the elec-

TOWARD EMULSION CONTROL 191 trical conductivity may be used in suitable systems to determine concentra- tion. The effects of emulsifiers on conductivity should always first be ascertained. It is also necessary to warn experimenters that the formation of "multiple emulsions" invalidates the application of the theory (11). DE•EE ov DISPERSION: SIZE F•EQUENC¾ ANAL¾S•S, LIGHT SCATTERING AND DIELECTRIC CONSTANT A direct indication of the work done in creating an emulsion is the area of interface that has been produced. As the emulsion ages the area of interface decreases. The most fundamental way of expressing emulsion stability is by means of the variation of interfacial area with time. The interfacial area is usually expressed in sq. cm. per cc. of emulsified liquid. For an average size of droplet of 2u, the interfacial area would be 30,000 sq. cm./cc., and would decrease to 20,000 sq. cm./cc. when the average droplet size had increased to 3u. A direct way to get both the average particle size and the interfacial area is by means of the microscope. Size distribution curves may be obtained by measuring about 400 droplets, but better accuracy is obtained if the number measured is even larger. Levius and Drommond (12) found a Bausch and Lomb camera lucida more convenient to use than photomi- crography. They report that they traced the outlines of from 400 to 800 drops per determination: "after some practice this operation could be performed in less than 45 minutes." The results reported by this optical method vary from 28,000 to 19,000 sq. cm./cc. The emulsions were pre- pared by premixing in a Waring blender for 10 minutes, and then passing through a hand-operated lever-type homogenizer. Some degree of stand- ardization is produced by this method, but the emulsions are relatively coarse. Emulsions prepared by the method of phase inversion, for example, produce much smaller particles, but they are then not visible under the microscope and some other method must be found. The advantages of the use of the microscope are that it is direct, inex- pensive, and yields a size frequency distribution as well as a value for the interfacial area. Other possible methods give only an average particle size and the interfacial area is based on that value. Where it is applicable, the use of the microscope is to be preferred before any other method. We are forced, however, to turn to other methods for very small emulsion drops. Van der Waarden (13) has reported the preparation of emulsions of medicinal oil in water, stabilized with from 5 to 35 per cent of alkylben- zene sulfonates in the oil, prepared by the method of phase inversion. The particle sizes were below the resolving power of a microscope, but could be measured by/i. ght-scattering methods. As the content of emulsifying agent was increased, average particle sizes decreased in the range of from 900 to
Purchased for the exclusive use of nofirst nolast (unknown)
From: SCC Media Library & Resource Center (library.scconline.org)