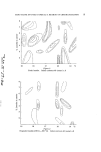
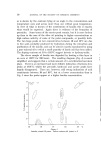
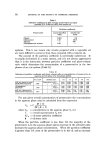
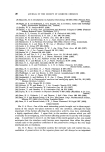
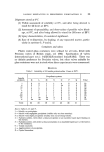
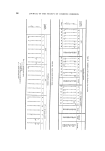
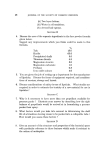
THE ACTIVITY OF AiNTIBACTERIALS IN TWO-PHASE SYSTEMS 21 the volume of oil contained within the latter and the oil/water interface created by the latter. Photographs show that a proportion of the organ- isms are adsorbed at the interface and, indeed, probably help to stabilize it. The o[w systems containing bacteria were shaken intermittently, and it is possible that organisms which at one moment were in the bulk aqueous phase were at another adsorbed at the aqueous side of the interface. It may also be deduced from interfacial tension measurements and the Gibb's adsorption equation, that the concentration of phenol at the inter- face is greater than in the bulk of the aqueous phase. What is uncertain is precisely how the phenol molecules and the organisms are aligned at• the interface, but it may be, assumed that the molecules at the interface penetrate the aqueous phase to a smaller depth than do the cells. It is therefore probable that part of the bacterial surface at the interface is in contact with a higher concentration of phenol, but this is certainly not true for the whole cell. A complicating factor is the concentration of phenol in the oil phase which is always related to that of the aqueous phase (Table II), and may behave as a reservoir for the latter. Our knowledge of all the factors operating to control the activity of pre-. serratires in two-phase systems is undoubtedly far from complete. Never- theless, the role played by the interface in determining the antimicrobial activity of a system seems too real to be ignored and has, in fact, been underlined by all the subsequent experiments we have carded out. An analysis of 400 experiments arranged in a randomized block design to determine the importance of the concentration of bactericide in the aqueous phase, and of the oil:water ratio in determining the antibacteria! Table III Analysis of variance of extinction-time data for E. coli in phenol/liquid paraffin/water dispersions at 25 ø Sums of Source of variation squares øF Variance F P 6 Between oil-water 404730.48 6 67455.08 409.94 0.001 ratios (R) 358 Between aqueous phase 5 phenol concentrations (P) 1945585.19 5 389117.04 52364.73 0.001 358 30 Interaction (RP) 865299.78 30 28843.33 175.286 0.001 358 Residual 58910.19 358 164.55 rota• 3274525.64 399 '

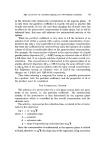
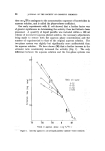
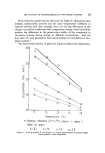
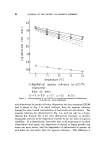
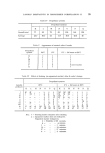
22 JOURNAL OF THE SOCIETY OF COSMETIC CHEMISTS activity of the systems again indicated the importance of the interface. An analysis of variance of the data is shown in Table HI. The two sources of variation shown are the only two assignable causes of variation in the extinction times, and both are highly significant (p = 0.001). The F-ratio indicates that the concentration of phenol in the aqueous phase has a greater effect in determining extinction time than does the oil:water ratio. This conclusion is in line with that reached by intuitive reasoning since for any given overall concentration of phenol, the oil:water ratio controls the phenol concentration in the aqueous phase, and it is the latter which largely determines activity. Of considerable interest is the interaction item which, when tested against the residual, is highly significant. It is sometimes difficult to understand the meaning of interactions in analyses of variance, but in this case the interaction between oil:water ratio and the concentration of phenol in the aqueous phase is in all probability the interfacial effect. Thus the statistical analysis of the data supports the conclusion derived from direct experi- mentation but additionally permits some estimate of importance to be assigned to the interface. Though highly significant it is statistically the least important of the three factors determining activity the magnitude of its effect is dependent on the other two factors. THE EFFECT OF TEMPERATURE The effect of temperature on the activity of bactericides in o/w systems may be complex. Any temperature in excess of about 50ø(2 will, per se, produce the death of vegetative cells either by protein coagulation or enzyme inactivation. There are, additionally, the indirect effects of tem- perature on the partition coefficient, and on the velocity of the bactericidal reaction. Our experiments studied the effects of temperature over the range 5-45 ø and revealed that the partition coefficient of some preservatives increases, and for others falls, as the temperature is raised (Table IV). Table IV Changes of partition coefficients as temperature of oil/water dispersions is increased from 5-45øC. Preservative Phenol Chlorocresol Chlorocresol Phenylmercuric acetate Oil phase Liquid paraffin Liquid paraffin Arachis oil Liquid paraffin Approximate ratio Køw at 45 ø Køw at 5 ø 260 per cent 170 .... 103 .... 50 ....
Purchased for the exclusive use of nofirst nolast (unknown)
From: SCC Media Library & Resource Center (library.scconline.org)