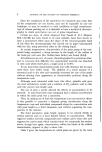
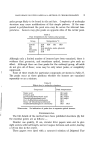
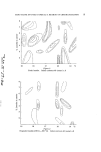
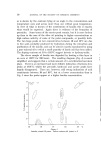
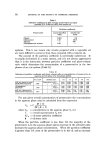
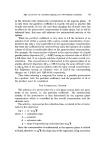
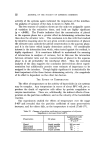
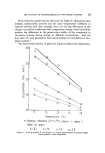
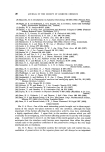
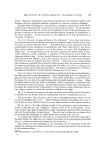
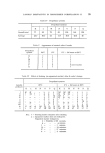
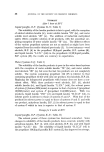
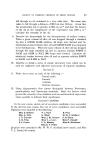
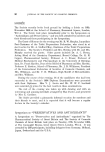
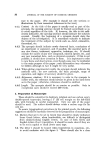
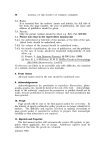
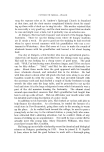
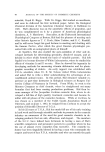
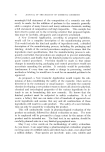
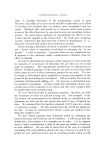
BAND SHAPE ON DYED PAPER AS A METHOD OF CHROMATOGRAPHY 7 6 15 16 17 18 Figure 1 Olive oil. Index contours 40 (outer) x $ 6 ¸ 4 -2' - ', : ,..,, '•I:' "' ", :'::'::'::•'" ': :: , ß '35: . ,35.,' , t i • ',: ,', ,,' : '..' /' / ' 30 : ,."30 ! ß s / • ! ß i • , , •1' 15 16 17 Figure 2 18 Pure mineral oil. Index contours 40 (outer) x 5 19 o C

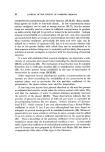
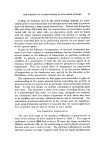
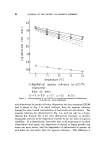
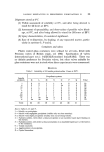
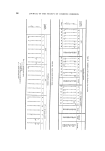
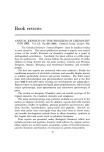
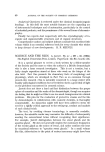
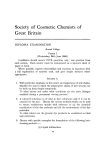
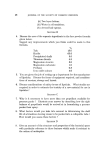
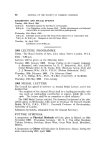
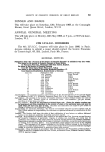
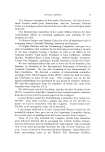
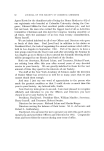
JOURNAL OF THE SOCIETY OF COSMETIC CHEMISTS observations per diagram. The contours were then drawn, taking into account the disposition of all index values. The amount of experimental material actually used per diagram is of the order of 0.05 g, and the accuracy with which the index could be repeated is within • 5ø,/0 of the actual index value. The minimum concentration of a polar compound which will give a peak is difficult to estimate, and undoubtedly varies with the surface activity. Compounds having quite low surface activity gave peaks when present in a concentration of less than 1% in the experimental material, and it seems probable that compounds having a high surface activity would be detected at much lower concentrations. RESULTS AND DISCUSSION Fig. 7 shows the type of diagram obtained for an oil consisting mainly of glycerides, in this case olive oil. The series of peaks on the left of the diagram, at 15.8øC, must represent compounds with free hydroxyl groups, i.e. partially acylated glycerol. The two small peaks at 16.4øC are ketones, possibly produced by the oxidation of secondary hydroxyl groups. The large, distorted, high index value area between 17 and 18øC is typical of the effect of very small quantities of polar substances on the carrier peak. This, in the absence of disturbing, polar groups, would be a narrow band across the diagram, parallel to the concentration axis at 17.6øC. This effect has been obtained with a very pure mineral oil. The peak area to the right of the diagram, at 19øC, cannot be definitely identified. It is possibly due to isomers of compounds giving peaks in the lower temperature range. The mineral oil, the diagram for which is shown in Fig. 2, has been solvent refined, but contains no antioxidants or other additives. The dashed contours are for index values of 40 and upwards, the dotted con- tours for 30 and 35. There are clear indications of peroxide formation (bottom left hand corner) of small amounts of hydroxy and ketonic compounds of traces of the carrier peak, and possibly of hydroxy-acids (18-19øC), but, apart from the peroxides, the quantities are, as one would expect, very small. The diagram for a sample of lanolin is shown in Fig. 3. Of the three types of material examined this represents the most complicated case. There are a large number of polar compounds, and all three types of polar group are represented. Some of the compounds are at least bifunctional
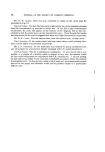
Purchased for the exclusive use of nofirst nolast (unknown)
From: SCC Media Library & Resource Center (library.scconline.org)