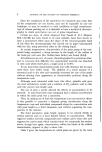
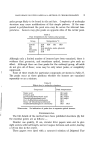
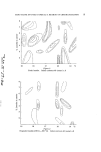
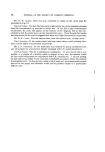
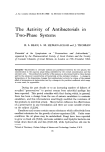
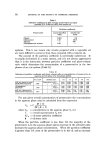
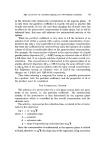
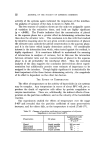
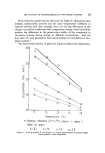
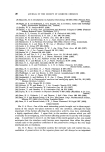
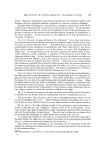
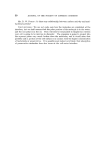
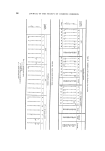
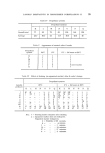
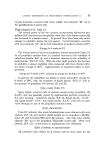
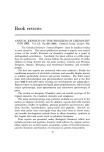
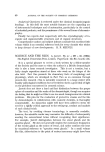
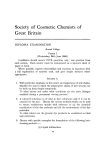
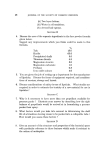
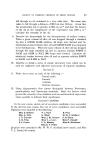
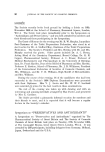
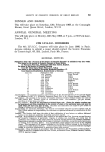
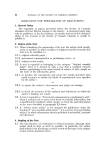
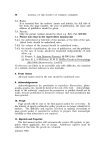
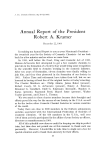
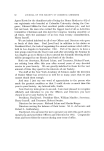
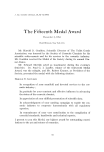
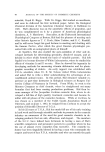
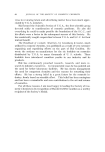
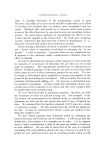
BAND SHAPE ON DYED PAPER AS A METHOD OF CHROMATOGRAPHY 9 15 16 17 18 19 øC Figur• $ Fresh lanolin. Index contours 40 (outer) x 5 • 6 15 16 17 18 19 øC Figur• 4 Degraded lanolin [100 hr--100 øC]. Index contours 40 (outer) x 5

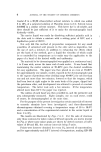
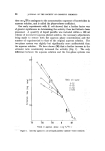
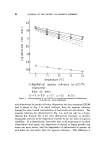
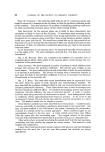
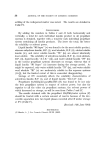
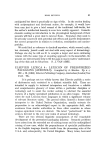
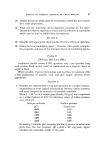
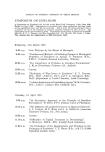
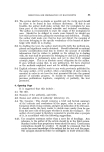
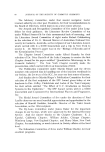
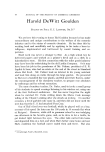
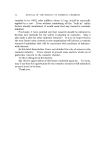
10 JOURNAL OF THE SOCIETY OF COSMETIC CHEMISTS as is shown by the contours lying at an angle to the concentration and temperature axes and across more than one critical peak temperature. In view of what is known of the constituents of lanolin this is exactly what would be expected. Again there is evidence of the formation of peroxides. Some traces of the carrier peak remain, but it is more broken up than in the case of the olive oil pointing to higher concentrations or high surface activity of some of the polar compounds, or possibly both. The two large peaks at low concentration between 18 and 19øC are due to free acid, probably produced by hydrolysis during the extraction and purification of the lanolin, and can be almost exactly reproduced by using a pure mineral oil to which a small quantity of lauric acid has been added. The sloping contours at 19 to 19.5øC suggest ketonic or hydroxy-acids. The above sample of lanolin was degraded by heating a thin layer in an oven at 100øC for 100 hours. The resulting diagram (Fig. 4) is much simplified, and suggests that a certain amount of re-esterification has taken place. There is an increased and more definite indication of ketones (two peaks at 16.4øC) whilst the peroxide, hydroxyl and carrier peaks have largely disappeared. There are, however, still strong indications of acid constituents between 18 and 19øC, but at a lower concentration than in Fig. $ since the peaks appear at a higher lanolin concentration. / •.// / // ! / I II I I I ! /! / III I ß ,, ,,' 15 Lanolin, stored 10 years. Index contours 40 (outer) x 5 øC
Purchased for the exclusive use of nofirst nolast (unknown)
From: SCC Media Library & Resource Center (library.scconline.org)