824 JOURNAL OF THE SOCIETY OF COSMETIC CHEMISTS ß ' I ß .

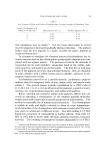
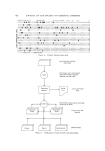
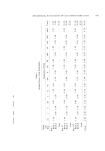
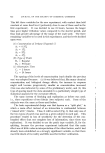
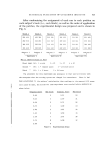
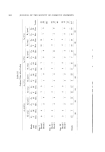
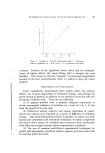
STATISTICAL EVALUATION OF CUTANEOUS IRRITANTS 825 RESULTS OF ANALYSIS OF SECOND EXPERIMENT Data The second experiment was carried out as described, and resulted in the raw data shown in Table III (after coding). All readings were made by a single experienced observer, as before. Analysis An "over-all" analysis of variance of the data shown in Table III was done following the usual computational procedures. The sums of squares for the concentration effect and its interaction were then par- titioned into segments representing linear, quadratic, and cubic (cubic is equivalent to higher curvature and scatter) portions. This final analysis is shown in Table IV. Discussion of Results (1) The partitioning of the concentration effect and its interaction with the other two variables resulted in a very strong test of significance for the linear effect of concentration (probability 1% that effect was not real). None of the double interactions with concentration were signif- icant, however, and although the triple interaction gave a weak signif- icance test as before, the authors were less disposed to accept it, since the previous indication was not strongly reinforced despite the parti- tioning. (2) The patch type-observation time interaction was significant, unlike results in the first experiment (if the triple interaction results for that experiment are ignored). (3) The experimental error mean square was estimated as 4.02, as shown in the table. This is strikingly similar to that of the previous experiment (remembering that a new scoring scale was used here) the estimated standard deviation for error would be x/4.02, or approxi- mately 2.0 units, corresponding to 0.50 original units, almost identical to the error found in the first experiment. Thus, again, the use of estimates to the nearest 1/• of an original scale unit was demonstrated to be practical. Applying the same reasoning as before, this result in- dicates, as before, that the average error of measurement was less than about 0.5 original scale units, including the error of estimation. Two of the effects showing considerable significance (linear concen- tration, A, and the patch type times observation time interaction, BC) are plotted in Figs. 7 and 8. The significant observation time effect
Purchased for the exclusive use of nofirst nolast (unknown)
From: SCC Media Library & Resource Center (library.scconline.org)