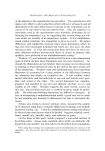
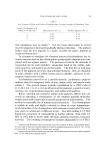
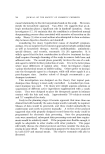
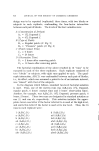
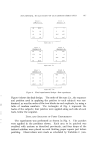
822 JOURNAL OF THE SOCIETY OF COSMETIC CHEMISTS This left three variables for the new experiment, with contact time held constant at some fixed level (preferably close to one of those used in the first experiment). It was decided to use 24 hours, because the longer time gave higher irritation values compared to the shorter period, and thus took greater advantage of the range of the scale used. The three remaining variables to be used in this experiment, and the levels decided upon were: (A ) Concentration of irritant (Duponol C) Ai = 0.5% A• = 1% A• = 2% A4 -- 4(7/0 (B) Type of Patch B• = Regular B.. = Pressure ( U) Observation Time C• = 2 hours Ca = 24 hours The spacing of the levels of concentration (each double the previous one) was adopted because: (a) it was believed that, like many chemical concentration and biological dosage effects, the increase in response might well become progressively smaller as concentration increased (this was also indicated by some of the preliminary work), and (b) this type of spacing made the data amenable to a particularly simple type of statistical analysis for the curvature effects. The same system of blocking and replication as before was used i.e., three repetitions of two blocks (two subjects) each. None of the subjects were the same as those used before. The basic experimental design was that known as a "split plot," in which a main effect instead of an interaction is confounded between ("mixed with") blocks. Thus, it will be noted (Fig. 6) that only one of the two types of patch was used on a given subject in each pak. This procedure results in loss of sensitivity for the detection of the con- founded effect (but not complete loss of information, since there was replication). It was decided to use the patch type variable, B, for the splitting, because the previous experiment indicated that this main effect was of little value in interpretation of the other factors, and it had already been established as a strongly significant variable, so that there was little doubt of its reality and little need for further verification.

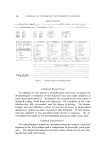
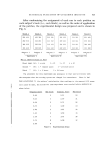
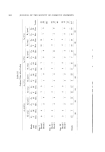
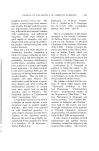
STATISTICAL EVALUATION OF CUTANEOUS IRRITANTS 823 After randomizing the assignment of each run to each position on each subject's back (i.e., each block), as well as the order of application of the patches, the experimental design was prepared and is shown in Fig. 6. Block 1 211 411 212 312 311 112 111 412 Subject 1 I Replicate 1 Block 2 422 321 421 221 222 121 322 122 Sub.i ect 2 Block 3 Block 4 212 311 111 312 112 411 211'412 Subject 3 I 121 122 322 421 321 221 222 422 Subiect 4 Replicate II Block 5 Block 6 211 212 412 111 311 411 312 112 Subject 5 Subiect 6 I . Replicate Ill Key to Identification of Runs: First digit (A): 1 = 0.5% 2 = 1% 3 = 2% 4 = 4% Second " (B): 1 = regular patch 2 = pressure patch Third " (C): 1 = 2 hours 2 = 24 hours 221 421 422 321 322 122 121 222 The procedure for this experiment was analogous to that used previously with the exception that the scoring system was changed for convenience. Since it had been established to the authors' satisfaction that readings to the nearest 0.25 score unit could be made, the scores for this experiment were recoded before analysis as shown below: Original Score New Score Original Score New Score 0.00 1 2.25 10 0.25 2 2.50 11 0.50 3 2.75 12 0.75 4 3.00 13 1.00 5 3.25 14 1.25 6 3.50 15 1.50 7 3.75 16 1.75 8 4.00 17 2.O0 9 Figure 6. Experimental design
Purchased for the exclusive use of nofirst nolast (unknown)
From: SCC Media Library & Resource Center (library.scconline.org)