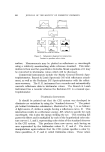
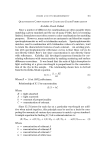
COLOR AND ITS MEASUREMENT 661 QUANTITATIVE COMPUTATION OF COLOR AND COLOR FORMULATION Kubelka-Munk Method Since a number of different dye combinations are often possible when matching a given standard and the use of many FD&C dyes is becoming limited, formulators must often resort to color combinations for matching purposes. However, many matches are metameric and therefore require spectrophotometric as well as tristimulus analysis. Spectrophotometric matches, used in combination with tristimulus values of a mixture, tend to retain the characteristic features of each colorant. An existing prob- lem with spectrophotometric reflectance curves is that these curves do not directly follow Beer's law since concentration is not directly linear with reflectance. Kubelka (22) developed numerous formulas for cor- relating reflectance with concentration by making scattering and surface difference corrections. It was found that the ratio of light absorption to light scattering at a given wavelength is proportional to the concentra- tion of the dye in the sample. The relationship shown here is derived from the Kubelka-Munk equation. (• - •)• (•) Where R = 1.0 at 100% reflectance. Relationship of K/S to concentration K/$ = kc (2) Where K = light absorbed S = light scattered k = constant of proportionality C = concentration of colorant Since K/S factors for each dye at a particular wavelength are addi- tive when mixed together, this principle may be used as a basis for com- puting the amounts of various dyes necessary to match a given standard. A sample equation for finding K/S of a colorant mixture is: (K/$),•x. = a(K/S)A + b(K/$)• + c(r/$)c + ...w(K/X)wh•e •se (3) Where a = concentration of colorant A b = concentration of colorant B c = concentration of colorant C w = concentration of white base

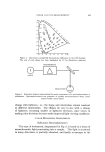
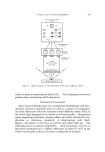
662 JOURNAL OF THE SOCIETY OF COSMETIC CHEMISTS This equation would be used as follows: The K/S for each dye and ex- cipient are first obtained by measuring the diffuse reflectance for a known concentration of the dye and excipient or white base at a given wave- length. This R value may be substituted in the Kubelka-Munk equa- tion (eq. 1), in order to calculate the K/S values, or these may be ob- tained directly from tables which give K/S values for reflectance reading between 0 and 100%. The K/S value of the diluent should be subtracted from each K/S of the dye to obtain the corrected K/S values. For example, one can calculate the K/S values of three dyes, blue, red, and yellow, separately at one wavelength. The total K/S values at that one wavelength will equal the K/S value of a brown, which results from the proper concentrations of the above three dyes. Therefore, if the value of the sample is known at three wavelengths and the K/S values of the blue, red, and yellow (at any concentration) are also known at the same wavelength, one may set up three simultaneous equations to calcu- late the actual concentrations of blue, red, and yellow used to make the match. The Davidson and Hemmendinger COMIC Computer per- forms these calculations at 16 wavelengths between 400 and 700 m/• and also calculates tristimulus values for the purpose of color matching (21). Weighted Ordinate Method This method, mathematically illustrated earlier in this presentation, is a means of calculating tristimulus values and chromaticity coordinates from reflectance data. It should also be stressed that x, y, and • are tristimulus values resulting from the average visual observer and are used as imaginary primaries under specific illumination for tristimulus cal- culations. The values X, Y, and Z, at any wavelength, correspond to the magnitude of these primaries needed by the standard observer to match a color. In addition, chromaticity coordinates, x, y, and z, are the tristimulus values X, Y, and Z expressed as fractions of their total, which equal one. These chromaticity coordinates of the tristimulus values are then plotted on an x, y chromaticity diagram and the spec- trum locus is located. The weighted ordinate method is a means of determining tristimulus values and sample lightness either from spectro- photometric reflectance curves or directly using tristimulus colorimetry. Using this method, the relative energy of the light source E c (for illumi- nant C) at a particular wavelength, which is found in published color tables (23), is multiplied by the tristimulus value •c and reflectance value for the same wavelength between 400 and 700 m/•, usually 10 m/• apart. The values are then summed over the total range to yield the X, Y, and
Purchased for the exclusive use of nofirst nolast (unknown)
From: SCC Media Library & Resource Center (library.scconline.org)