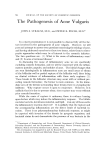
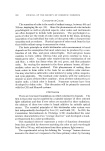
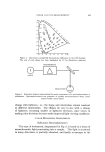
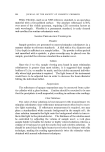
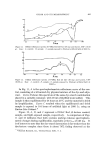
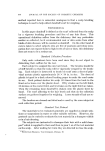
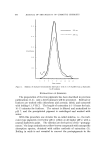
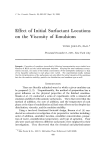
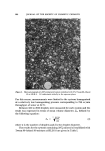
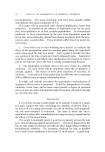
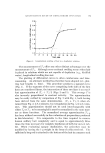
COLOR AND ITS MEASUREMENT 66 3 100 ' 80- 60- I I I 400 500 540 600 700 •mu Figure 10. Diffuse reflectance spectra of FD&C Red #3 Dye (100 mg) and light magnesium carbonate, USP (2.00 g). Key: A, standard dye spectrum: B, new sample lot spectrum Z tristimulus values. Chromaticity coordinates are then calculated by expressing the tristimulus values as fractions of their total values. The luminosity or lightness is determined directly from the Y tristimulus value expressed in per cent. Although there are other available methods for calculating tristimu- lus values (23), the weighted ordinate technique serves as a good means for deriving color values from diffuse reflectance measurements. I•HARMACEUTICAL APPLICATION Quality Control of FDiC Dyes The purity and quality of pharmaceutical dyes may be controlled, as illustrated with the following example: A manufacturer purchases a new lot of FD&C Red #3 dye. The predetermined standard spectrum of this dye compared to a MgCO3 reference standard is shown in Fig. 10 The spectrum for the standard dye is also diluted in a 1:20 ratio with MgCO3, since it is important that the color component be highly diluted with a relatively nonabsorbing diluent. This ensures a similar grain size for the dye and reference standard, causing the reference and sample scattering coefficients to cancel each other in comparison measurements. This facilitates scattering to be independent of wavelength (24).

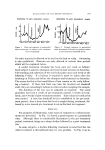
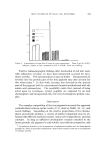
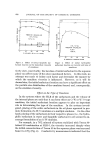
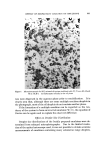
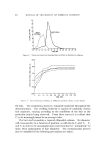
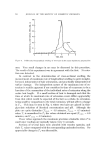
664 JOURNAL OF THE SOCIETY OF COSMETIC CHEMISTS The specifications for 100 mg of standard dye diluted with 2.00 g of MgCO3, (Fig. 10,A) are as follows' Xm•x = 540 mu R = 62.8% (K/S = 0.1102) Tolerance = •- 10%. A new lot of FD&C dye (Fig. 10,B) gives the following spectrophotometric values after 100 mg of the dye has been diluted with 2.00 g of MgCO3 USP' X ..... = 540 m• R = 65.5% (K/S = 0.0909). Since K/S values are proportional to concentration, the purity of the new lot may be found from the calculations shown below, assigning a purity of 100% to the standard dye. K/Ssta. Csta. _ (4) K/Xsamrle Csample Where K = absorption coefficient S = scattering coefficient C = dye concentration in % 0.02 oo% = -- Csamp•e = 81.6% 0.0909 Csample The new sample lot should be rejected, since it contains 18.4•c im- purities. It should be emphasized that the colorist must check the linearity of K/S values with concentration, and the experiments should preferably be performed within a close concentration range in order to en- sure better accuracy (24). Tristimulus colorimeters may also be used to control the color and lightness of pharmaceutical dyes. This is done by plotting x and y chromaticity values for a known standard dye and establishing permis- sible color differences for new lots. The sample lightness may be con- trolled by comparing the sample's Y tristimulus value to that set for the standard dye. This is a rapid and easy quality control technique for new sample lots of FD&C dyes. Dye-A djuvant Chemisorption Studies Several articles have appeared in the literature with respect to color stability and other changes resulting from the interaction of dyes with pharmaceutical adjuvants (25-27). Results of a dye-adjuvant chemi- sorption study (25) using diffuse reflectance techniques are presented in Figs. 11 and 12. The former represents the results of equilibrating FD&C Red #3 dye with starch USP in an aqueous dispersion medium, followed by lyophylization (25).
Purchased for the exclusive use of nofirst nolast (unknown)
From: SCC Media Library & Resource Center (library.scconline.org)