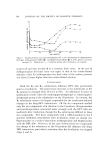
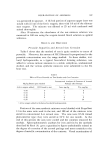
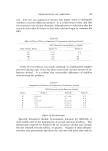
188 JOURNAL OF THE SOCIETY OF COSMETIC CHEMISTS the inner walls of the cans produced little of a quantitative nature, but did indicate that corrosion occurred largely at almost microscopic pin- holes, possibly imperfections in the tin coating. The data in Table I leave little doubt that tin and iron contamination of the contents of the aerosol cans, during a typical accelerated storage test, is likely to increase with increasing liberation of HC1 in the 24-hour test conducted in glass. Effect of Water Content of Alcohol Table II presents data on a pure undenatured alcohol, originally containing less than 0.02% moisture, to which various amounts of water were added prior to test. Water content in the "anhydrous" range (nomi- nally below 0.1%), even up to 0.4%, liberated no more HC1 in the test than the original alcohol. Between 0.8 and 6.2% water the instability of the system increases essentially proportionately. At 7.6% water, corre- sponding to 95 vol % (190-proof) alcohol, the system is quite unstable--a fact well known to the industry. Table II Effect of Moisture on Test Results % on Alcohol Water content by wt Alcohol content by vol Test Results: HC1 Liberated, mg/kg Based on Alcohol O. 02-0.4 100-99.8 0.8 99.5 1.6 99.0 3.2 98.0 4.7 97.0 6.2 96.0 7.6 95.0 04 07 12 20 34 42 70 + The important feature of the above observations from the standpoint of present considerations is that anhydrous alcohol products of commerce can be tested and compared without unnecessary concern for the exact moisture content in the specified range. Application of Test to Commercial Alcohol Samples Table III gives test data on anhydrous samples from two sources. These samples showed significant difference in the results of the 24-hour

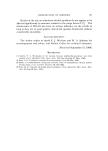
DEGRADATION OF AEROSOLS 189 test. The test was repeated at shorter and longer times to determine whether or not the difference persists. It is evident that it does, and that the reaction is one of some duration, although there is indication that the reaction slows after 48 hours or that side reactions begin to consume the HC1. Table III Effect of Time of Test on Commercial Undenatured Anhydrous Alcohol HC1 Liberated, mg/kg Based on Alcohol Time of Test, Hours Source X Source Y 16 0.3 1.2 24 0.8 1.7 48 4.6 26 72 8.4 28 Table IV lists 24-hour test results obtained on undenatured samples procured during each of the last three years from various sources of an- hydrous alcohol. It is evident that measurable differences of stability exist between the products. Table IV Comparison of Commercial Undenatured Anhydrous Alcohols HC1 Liberated, mg/kg Based on Alcohol Source Series A Series B Series C U 0.0, 0 V 0.1 W 0.1,0 X 0.9 Y 1.4 Z 1.7, 1 1 0.7, 0.8 0 4 + 3 4 0.5, 0.5 1 0.3, 0.7 2 1.4, 1.5 1 2, 1.6,1.2,1.2 1.4,1.8 1 Effect of Den,aturants Specially denatured alcohol, Govermnent Formula 40 (SDA-40), is most widely used in the formulation of aerosol personal products. The denaturants required by Formula 40 are tert-butyl alcohol and include brucine alkaloid, brucine sulfate, o,r quassin. Samples of these denatur- ants that met govermnent specifications, and also had good odor and no
Purchased for the exclusive use of nofirst nolast (unknown)
From: SCC Media Library & Resource Center (library.scconline.org)