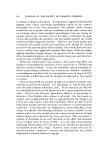
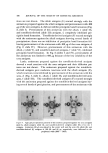
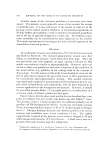
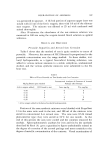
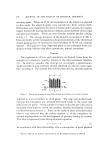
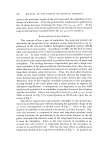
200 JOURNAL OF THE SOCIETY OF COSMETIC CHEMISTS PARTICLE SIZE This graphical exposition of the mechanism of curvature also suggests the means by which particle size is determined. After pressures in the film have been equalized, the areas/molecule at the sides of the curved film are trw and fro, or more generally tr0 and tri at the external and internal sides of the curved interphase. The areas at each side of the interphase will thus be these terms multiplied by the number of fatty acid species in the interphase. Now film curvature may be expressed as the ratio of the areas of the external and internal sides of the curved interphase, (R/R -- T) e, in which R is the external radius of the spherical droplet (internal phase plus interphase) and T is the thickness of the interphase. Hence, (Yi For the O/W emulsion of Fig. 5, (•w/(•o -- 100/60. If a value o[ 25 • is used [or the thickness o[ the stearic acid •lm, • is 110 •. This is a reason- able value [or a translucent emulsion exhibiting slight Tyndall scattering, such as a •oor polish emulsion. In the hypothetical W/O emulsion him represented by Fig. 6 the ratio o• •o/•w = 168/42 = 4, so that with a film thickness of 25A, R is 50 •. This droplet size co•esponds to the clear, transparent, W/O microemul sions originally made by Schulman (9). %' c ____••___ ( y2)• 6'- Figure 6. Curvcs of ,r-o- of mixed fihn of water/oil microemulsion. Curve AB represents oil side and CD the water side curve EF is sum of AB and CD. Large ratio of o'o/aw arises from condensed behavior of CD and high area/molecule at low pressures of AB GRAPHICAL CHARACTERIZATION These considerations have imznediate practical application by making possible a graphical characterization of the process of emulsification in

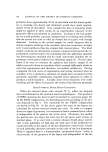
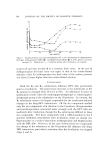
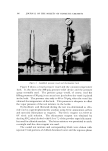
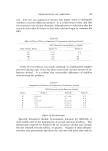
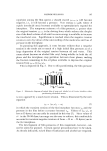
MICROEMULSIONS 201 55 dynes/cm. I I lg. 2 .'1 4 OCTADECANOL Figure 7. Characterization of process of emulsification by means of curves of (?o/w)a and •'• versus fraction of alcohol component of mixed film that partitions to the oil phase and inter- phase, respectively terms oi •0 and (yo/w)•. This is done by plotting pairs of curves of ,•0 and (yo/w)• as ordinates versus concentration of alcohol as abscissas, as in Fig. 7 (5). The emulsion represented by the middle pair of curves is the emulsion of Fig. 5 in which the soap is AMP-stearate. In the left hand pair of curves, kerosene replaced the octadecane and in the right hand pair, Nujol* replaced the octadecane. Intersection of these curves in- dicates microemulsion formation failure to intersect, a macroemulsion. The concentration of alcohol shown on the abscissas represents the total in the system. For the (yo/w)• curves, the alcohol concentration is plot- ted as that fraction of total alcohol that is in the oil phase and for the •-• curves, as that fraction in the interphase. With kerosene and octadecane, the (yo/w)• curves interest the •-• curves before the film pressure drops too far from its peak value. But in the Nujol pair, partitioning of the alcohol between the oil phase and interphase is unfavorable to this be- * Plaugh, Inc., Memphis, Tenn.
Purchased for the exclusive use of nofirst nolast (unknown)
From: SCC Media Library & Resource Center (library.scconline.org)