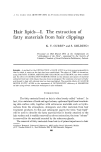
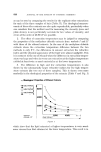
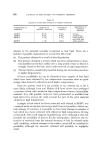
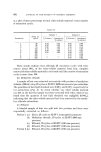
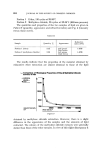
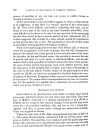
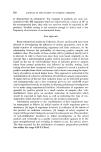
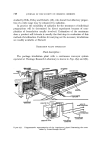
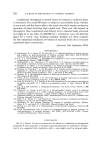
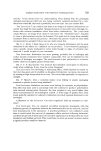
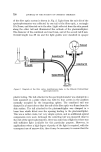
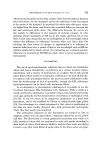
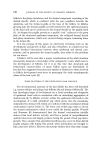
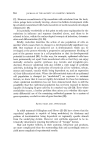
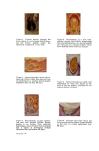
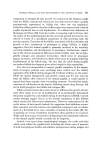
GUINEA-PIG HAIR FOLLICLE FOR EXPERIMENTAL OBSERVATION 703 the left of the dorsal mid-line immediately behind the left scapula using blunt, square-ended forceps. The hair samples were subsequently sorted into the different fibre types recognized by Danforth (20) and used by Dawson (13) (Fig. 1). The classi- fied hairs were then mounted on 82 X 82 mm lantern slide cover glasses (previously cleaned in 70% alcohol) using a mixture of 0.5% gelatine and 0.05% chrome alum. Each cover glass was allowed to dry in a place free from dust, and then brought into contact •vith a photographic plate {Ilford special lantern contrasty Ibackedl), in a dark room using recommended safelights. The cover glasses and photographic plates were held together by four Myers 19 mm foldback clips. The plates were then wrapped in black polythene sheeting and stored at 3øC in light-tight boxes. Two to four weeks later, the plates were processed using Kodak D19 developer. Figure •. Autoradiographed fibres after exposure for three weeks (dorsal region) The autoradiographs show a series of spots (Fig. 2) corresponding to each daily injection of radioactive material. Each spot is relatively well defined at its upper end but gradually fades away towards its lower end. A travelling microscope with a 34 X magnification was used to measure the distances between the series of standard reference points, namely the site at the upper end of each spot where the black dots of the silver grains stretch right across the hair shaft.

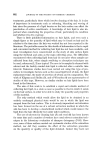
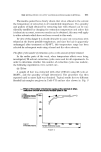
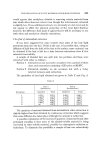
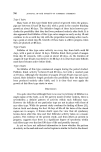
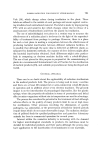
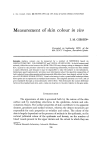
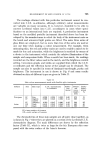
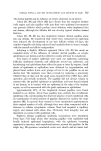
704 JOURNAL OF THE SOCIETY OF COSMETIC CHEMISTS RESULTS The measurements can be used to produce several kinds of information. Firs fly it is possible to calculate the mean daily rate of growth for hairs over the whole period of the observations. Secondly, counting the number of autoradiographic images along the length of each hair, it is possible to calculate the duration of anagen for each hair type. Thirdly, since all the hairs from a complete area of skin were autoradiographed, the relative number of hairs starting to grow each day can be ascertained. The rate of growth The period of investigation was sufficient only to produce complete hairs of type 2. Fig. $ shows the mean growth rate curve of such hairs, based 0.6 RATE OF GROWTH 0.5 0.2 6 12 18 24 30 NMBER OF OAY$ OF ANAGE. Figure $. Mean growth rate curve of the type 2 hairs (n:6).
Purchased for the exclusive use of nofirst nolast (unknown)
From: SCC Media Library & Resource Center (library.scconline.org)