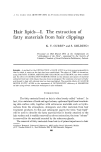
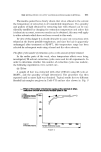
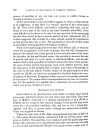
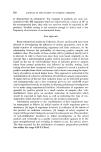
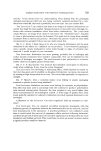
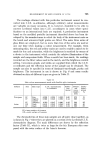
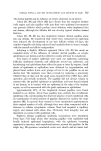
Figure 6 Production version of flexible optic 3•intometer in use. Facing page 735

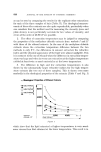
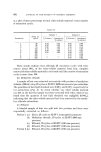
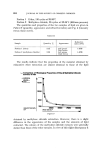
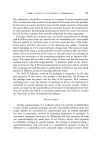
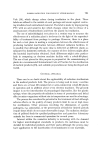
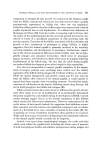
MEASUREMENT OF SKIN COLOUR IN VIVO 735 The readings obtained with this particular instrument cannot be con- verted into C.I.E. co-ordinates, although arbitrary colour measurements are valuable on many occasions. It is, however, desirable to be able to convert Lovibond values into C.I.E. co-ordinates in cases where speci- fications on an international basis are required. A production instrument based on the modified portable instrument described above has been de- veloped by the manufacturers in xvhich the body of the instrument rests on the bench and armoured light guides are fitted. The same three series of glass filters are employed, but no more than two of the series are used at any one time when making a colour measurement. For example, when measuring skin, the red and yellow scales are used to enable a match to be made for hue and saturation, while the brightness is matched by means of a device in the instrument which controls the relative illumination of the sample and comparison fields. When a match has been made, the readings recorded are the filter values used in the match, and the brightness control setting. Conversion graphs and tables are supplied from which the C.I.E. co-ordinates and the reflection factor of the sample can be obtained. The sample can also be specified in terms of dominant wavelength, purity and brightness. The instrument in use is shown in Fig. 6 and some results obtained on skins of different types are given in Table II. Table II Skin colour measurements made with flexible optic tintometer Subject Site Skin type C.I.E. chromaticity•ation)Purit(Satur-antwave-lengthDomin-tionfactorReflec- co-ordinates European IF Fair 6.339 0.339 0.325 0.60 579 • 15 IF Slightly 0.359 0,349 0.292 0.44 583 24 tanned IF Inflamed 0,373 0.347 0.280 0.35 590 25 Asian OF Dark 0,412 0.343 0.245 0.30 582 40 IF Dark 0.426 0,310 0.264 0.34 583 / 33 IF=inner surface of forearm OF=outer surface of forearm The chromaticities of these skin samples are all quite close together, as is shown in Fig. 7 where they are plotted on a section of the Lovibond C.I.E. chromaticity diagram. The main differences are shown by the reflection factor (Table II), which is twice as large for the fair European skin com- pared with the outer surface of the Asian's forearm.
Purchased for the exclusive use of nofirst nolast (unknown)
From: SCC Media Library & Resource Center (library.scconline.org)