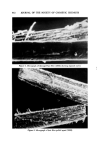
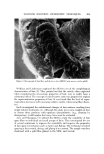
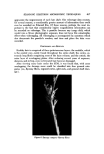
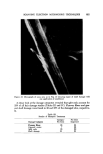
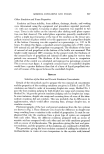
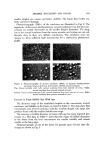
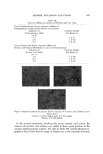
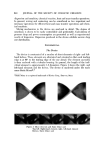
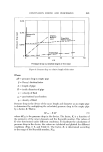
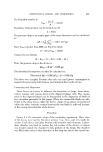
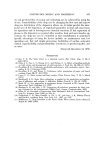
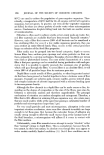
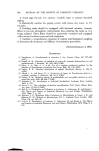
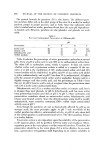
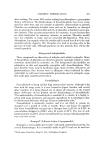
620 JOURNAL OF THE SOCIETY OF COSMETIC CHEMIST$ Figure 10. Micrograph of general shaft damage before treatment with conditioning formulation Table II Difference Ratio (DR) Values Conditioner • Shampoo • Total number of panelists 50 15 Total number of hairs evaluated 192 59 Total number of damage sites evaluated 442 127 Average difference ratio calculated 0.26 0.47 DR range per panelist 0.03--0.66 0.28-0.71 "Shampoo and leave-on conditioner supplied by the Mennen Co., Morristown, N.J. Both products are protein formulations.

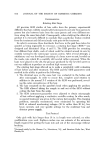
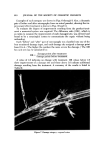
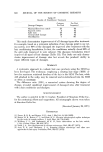
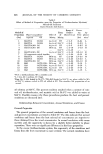
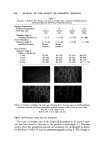
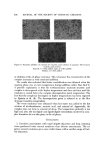
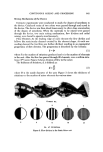
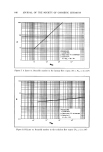
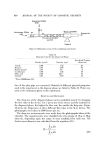
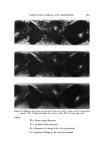
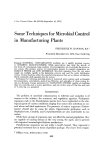
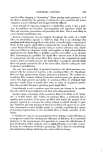
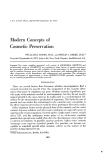
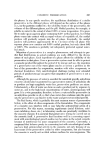
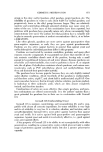
SCANNING ELECTRON MICROSCOPIC TECHNIQUES 6•1 - . .. . -:..: . ... :.: . -. ?.• -•, -(,:/.•..:"*'• . :}'.•... •, ,--:•: :... -. \ ":'? ::•-, • •.•.. .... '-.%..,, . ½•.•..• .•¾ , -.: ..... • •.-•' '•. . •.. .... :•.• •.. . .... . ? :• • ß • '"' .. . .: ... Figure 11. Micrograph of same area as in Fig. 10 showing repair of shaft damage with one application of conditioner A closer look at the damage categories revealed that split ends account for 35% of all hair damage studies (Tables III and IV). Flyaway fibers and gen- eral shaft damage were found in 32 and 25% of the damaged sites, respective- ly. Table III Results of Shampoo Treatment Category Per Cent Damage Category Per Cent Improved Flyaway fibers 35 93 Exposed cortex 7 88 Split ends 35 60 Shaft damage 23 93
Purchased for the exclusive use of nofirst nolast (unknown)
From: SCC Media Library & Resource Center (library.scconline.org)