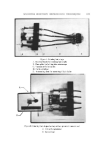
626 JOURNAL OF THE SOCIETY OF COSMETIC CHEMISTS Evaluation o[ Emulsions and Foams Microscopic Observations Photomicrographs of the mineral oil concentrates were obtained with a standard Bausch and Lomb monocular dynoptic model equipped with a mi- croipso viewing attachment and a 31/4 x 4V4 Leitz Polaroid camera. The emul- sions were placed on a slide with a cover glass. Photomicrographs were taken at a magnification of 150x using a 15x eyepiece and a 10x obiective. Type 52 Polaroid 4 x 5 Land Film was used with a 15-sec exposure time. The light source was an American Optical Corp. Model 651 illuminator.* The diameters of the emulsified droplets on the photomicrograph were esti- mated with a scale prepared by photographing a stage micrometer at the same magnification as that for the emulsions. The scale was calibrated in in- tervals of 10/x. Diameters down to about 2/x could be estimated. Droplets with diameters less than 2/x could be detected but not measured with any accuracy. Edmundson (3) reported that 1-2 /x was the smallest diameter of a particle that could be measured with any precision. The variation in droplet size is reported by the range of diameters between the largest and smallest droplets. To obtain the range of diameters of the emulsion droplets, the field under the microscope was scanned until the larg- est droplet was found. This portion of the field was photographed. The diame- ter of the largest droplet was measured and that of the smallest was estimated. It must be emphasized that the diameter range has no particular relationship to average droplet size. However, when combined with observations of the photomicrographs and the emulsion creaming times, the diameter range as- sumes significance as far as emulsion quality is concerned. The same tech- nique was used for foam bubbles. The aerosol emulsions were photographed in the pressure cell described in a previous publication (1). Photomicrographs were taken at 300x with a 15x eye piece and a 20x long-range objective. The emulsions were very opaque, particularly those with excess myristic acid. Even the very strong light source usedt did not give sufficient light transmission for distinct photo- micrographs of the excess myristic acid emulsions. As a result, the diameters of the droplets were only estimated. The light transmission was sufficient to obtain satisfactory photomicrographs of the emulsions with excess triethanola- mine. Aerosol foams were photographed at 150x using the technique reported earlier (1). Augsburger and Shangraw reported a method for bubble size analysis based upon photomicrographs of aerosol foams (4). øAmerican Optical Corp., Buffalo, N.Y. ?Professional Illumination Model PR-27, Bausch & Lomb, Inc., Rochester, N.Y.

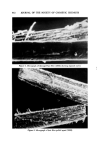
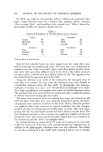
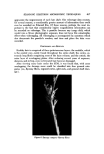
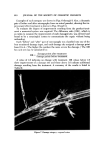
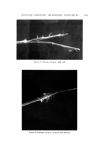
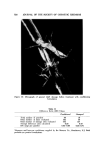
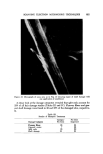
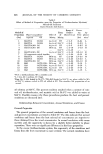
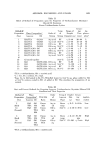
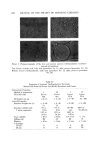
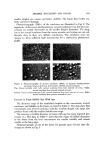
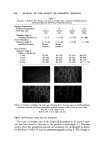
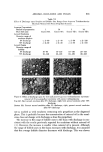
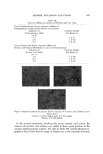
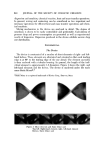
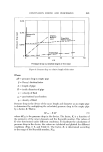
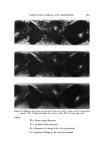
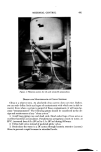
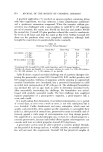
AEROSOL EMULSIONS AND FOAMS 69.7 Other Emulsion and Foam Properties Emulsion and foam stability, foam stiffness, drainage, density, and wetting were determined using the equipment and procedures reported previously (1) with one exception. Creaming or phase separation was reported in two ways. Times in the tables are the intervals after shaking until phase separa- tion was first observed. The initial phase separation generally manifested it- self by a slight layer formation at the top of the emulsion as the denser pro- pellant/mineral oil phase settled or by the appearance of a propellant droplet at the bottom. Creaming was also reported as a percentage, i.e., 1.5% in 24 hours. To obtain this figure, a standard aerosol consisting only of 80% water, 10% mineral oil, and 10% propellant was prepared. The thickness of the layer of mineral oil and propellant at the bottom of the bottle was measured. This height would represent 100% creaming. In the present work, the thickness of the creamed layer of propellant and mineral oil after aging for various time periods was measured. The thickness of the creamed layer in comparison with that of the control was calculated and expressed as percentage creamed. This is not an exact figure. A completely creamed layer of emulsified droplets would have a greater thickness than that of a layer of liquid propellant/min- eral oil because of the spaces between the emulsified droplets. •.]•SU'LTS Selection of the Best and Poorest Emulsion Concentrates Details of the 14 methods used to prepare the two mineral oil concentrates and the properties of the resulting emulsions are given in Tables I and II. The emulsions are listed in order of increasing droplet size range. Method No. 1 gave the best emulsion judging by both droplet size range and creaming time. Method No. 14 gave the poorest emulsion judging only by droplet size range. In some instances, droplet size range and creaming times of some of the inter- mediate emulsions did not correlate. This was probably due to differences in agglomeration, which would affect creaming time, average droplet size, or emulsion viscosity. Photomicrographs of the best and poorest emulsions from the two systems are shown in Fig. 1. These illustrate very clearly the difference in droplet size range resulting from a variation in the method of preparation. It must be em- phasized that only the emulsions from a given type of system are compared with each other. Thus, the different emulsions prepared with an excess of myristic acid are compared with each other and not with emulsions prepared with an excess of triethanolamine. The procedures giving the best and poor- est emulsions, and the properties of the emulsions, are condensed in Table III. The procedure giving the best emulsion consisted of adding the solution of triethanolamine in water at room temperature to the myristic acid/mineral
Purchased for the exclusive use of nofirst nolast (unknown)
From: SCC Media Library & Resource Center (library.scconline.org)