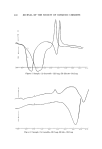
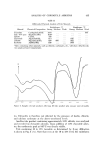
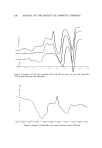
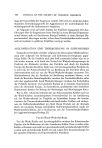
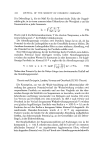
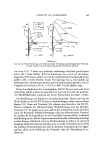
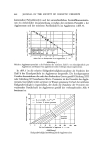
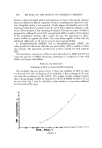
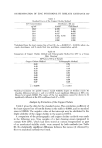
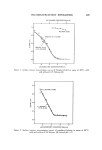
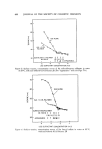
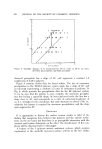
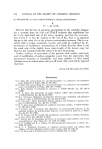
456 JOURNAL OF Tile SOCIETY OF COSMETIC CHEMISTS mixture is then extracted with several portions of water. The pooled aqueous layers are diluted to 200 mi. A portion of this is centrifuged to clarify the solu- tion. Complete clarity is not required. A high degree of turbidity may be tol- erated provided that it is stable. Next, 0.2 ml of ferric chloride solution is add- ed to a 10-ml aliquot of the centrifuged solution. The time is noted. A blank is prepared by adding 0.2 ml of 2.5% concentrated HC1 to another 10-ml aliquot of the centrifuged solution. After exactly 35 rain, the absorbance is dcter- mined at 608 nm against the blank. The color fades rapidly at first, but has stabilized suffciently in 35 rain to permit good reproducibility. In dimethylsulfoxide (DMSO) and in dimethylfonnanide (DMF), the colors produced with ferric chloride are quite stable. ZPT is soluble in these two solvents. The operations are the same as those carried out with aqueous HC1. The absorbance maximum is 595 nm when the solvent is DMF and 575 nm when the solvent is DMSO. Maximum absorbance is reached in 4 rain with DMF and 10 rain with DMSO. I•ESULTS AND DISCUSSION Solubility of ZPT in Neutral EDTA Solution The solubility data are given in Fig. 1. Since the solubility of ZPT in water is extremely low, the mechanism of its solubility is the exchange of the zinc ion from the pyrithione to the EDTA. The copper chelate method requires that a 10-rag sample of ZPT be dissolved in 50 ml of 0.0625 M EDTA. It can be seen from Fig. i that its solubility in this solution is more than sufficient for the needs of the assay. I .OOl .002 o ,004 DO6 .01 .02 .04 .06 EDTA, Moles/I. Figure I .1 .2 .4

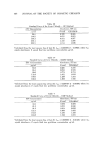
DETERMINATION OF ZINC PYRITtlIONE BY CHELATE EXCHANGE 457 Table I Standard Curve of the Copper Chelate Method ZPT Concentration Absorbance, 321 nm t•g/ml Found Calculated s 15.0 0.372 0.364 20.0 0.497 0.496 25.0 0.617 0.627 30.0 0.762, 0.756 0.760 40.0 1.025 1.023 60.0 1.552 1.550 •Calculated from the least squares line of best fit: A•, = 0.02635 Z - 0.03100, where A•_• equals absorbance and Z equals final zinc pyrithione concentration/•g/ml. Table II Comparison of Copper Chelate Method and Polarographic Method for ZPT in a Cream Hair Dressing s ZPT gram/100 g of Sample Copper Chelate Method Polarographic Method 0.46 0.54 0.49 0.47 O.49 0.49 0.50 0.47 O.46 0.51 0.49 0.45 O.46 0.51 0.48 0.50 0.47 0.49 x ----- 0.4778 y • 0.4917 sStatistical treatment (4): pooled variance equals 0.02230, degree of freedom equals 16. Absolute difference between x and y is 0.0139. Least significant difference at 95% con- fidence level equals 0.0223. The means of the two populations cannot be shown to be significantly different at the 95% confidence level (P ---- 0.05). Analysis by Formation of the Copper Chelate Table I gives the data for the standard curve. The correlation coefficient of the least squares line of best fit shown in the table is 0.9998, and its standard error is 0.00538. The negative value of the intercept may be attributed to the slight solubility of the copper chelate in the aqueous EDTA. A comparison of the polarographic and copper chelate methods was made in the following way. Nine samples of a hair dressing cream (prepared to contain 0.5% ZPT), which had been stored at various temperatures as part of an accelerated stability study, were assayed by both methods (see Table II). No statistically significant difference between the means (4) obtained by the two analytical methods was found.
Purchased for the exclusive use of nofirst nolast (unknown)
From: SCC Media Library & Resource Center (library.scconline.org)