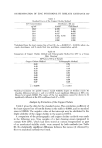
458 JOURNAL OF THE SOCIETY OF COSMETIC CHEMISTS Table III Standard Curve of the Ferric Chloride - HC1 Method ZPT Concentration Absorbance, 608 nm vg/ml Found Calculated" 50.1 0.320 0.320 100.2 0.652 0.649 150.3 0.971 0.977 200.4 1.310 1.306 250.5 1.634 1.635 "Calculated from the least squares line of best fit: Ao0s = 0.006559 Z - 0.00840, where A,,• equals absorbance Z equals final zinc pyrithione concentration tzg/ml. Table IV Standard Curve of Ferric Chloride - DMSO Method ZPT Concentration Absorbance, 575 nm txg/ml Found Calculated • 33.2 0.260 0.256 66.4 0.513 0.515 99.6 0.771 0.774 132.8 1.031 1.032 166.0 1.288 1.291 199.2 1.555 1.550 •Calculated from the least squares line of best fit: A.,7, = 0.007797 Z - 0.00300, where equals absorbance Z equals final zinc pyrithione concentration gg/m]. Table V Standard Curve of Ferric Chloride - DMF Method ZPT Concentration Absorbance, 595 nm •g/ml Found Calculated • 30.6 0.270 0.268 61.9. 0.533 0.540 91.8 0.814 0.812 122.4 1.090 1.083 153.0 1.350 1.355 183.6 1.628 1.627 :'Calculated from the least squares line of bets fit: A•s = 0.008886 Z - 0.00420, where equals absorbance Z equals final zinc pyrithione concentration gg/ml.

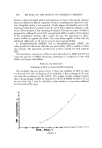
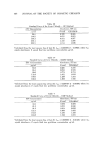
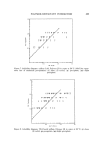
DETERMINATION OF ZINC PYRITHIONE BY CHELATE EXCHANGE 459 Table VI Analysis of various formulations by the Ferric Chloride -- I1C1 Method ZPT, per cent (W/W) Product 'Theory Found Shampoo 2.00 2.02 0.0 0.0 Hair dressing 0.48 0.49 0.0 0.0 0.50 0.49 _ 0.007P •Standard error of the mean of 7 batches of hair dressing. Analysis by Formation of the Ferric Chelate Tables III, IV, and V give data for the standard curves for ferric chelate in aqueous HC1, DMSO, and DMF, respectively. The coefficient of correlation for the least squares line of best fit for all of these methods is 0.9999. The standard error of the estimate is 0.0037 for the aqueous HC1 method, 0.0032 for the DMSO method, and 0.0046 for the DMF method. Table VI shows the results of the assays of various experimental formula- tions when carried out by the ferric chloride-HC1 method. In a shampoo, which had been prepared to contain 2.0% ZPT, 2.02% was found. In the ab- sence of ZPT in the formulation no absorbance was obtained at the maxi- mum for the ferric chelate. When 0.48% ZPT was added to a hair dressing, 0.49% was found on assay by the ferric chloride method. No absorbance was found in the absence of ZPT. When 7 batches of the hair dressing prepared to contain 0.50% were assayed, a mean recovery of 0.49% - 0.0071 was obtained. ACKNOWLEDGMENT The authors wish to express their appreciation to Irwin Margolin, under whose direction the assays for ZPT in finished products are carried out. (Received December 20, 1974) REFERENCES (1) R. T. Brooks and P. D. Sternglanz, Titanometric determination of the N-oxide group in pyridine-N-oxide and related compounds, Anal. Chem., 31, 561 (1959). (2) Olin Matheson Test Method-CL-24-863. (3) A. F. Krivis, E. S. Gazda, G. R. Supp and M. A. Robinson, Polarographic analysis of a series of metal ion 1-hydroxypyridine-2-thione systems, Anal. Chem., 35, 966 (1963). (4) (3. W. Shedecor, Statistical Methods, Iowa Univ. Press, Ames, 1964, p. 251.
Purchased for the exclusive use of nofirst nolast (unknown)
From: SCC Media Library & Resource Center (library.scconline.org)