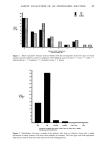
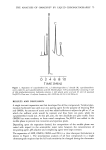
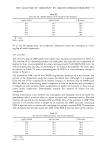
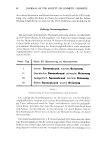
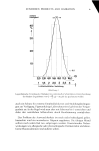
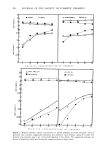
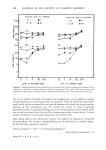
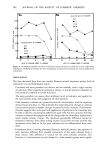
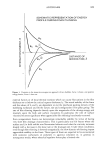
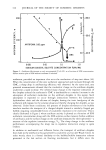
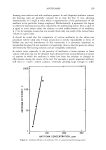
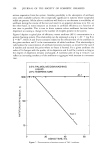
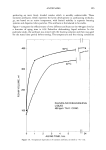
96 JOURNAL OF THE SOCIETY OF COSMETIC CHEMISTS 8 10- 0.5 0 1 ß CARVONE A I NDOLE A HYDROCOUMARIN ß SAGE 01L ..... • ..... _e ...... -e ....... ß / / / // I I I I m I I I " 2 3 4 5 I 2 3 4 5 RELATIVE CONCENTRATION OF ODORANT 8 ,4 /",ETHYL VANILLIN •HELIOTROPIN z'•PINE OIL •TERPINEOL m • •.o 0.5 .,• •e /Xf •'"" ./ / - •1 •' I • I m I / I I I 1 2 4 • 1 2 3 4 RELATIVE CONCENTRATION OF ODO RANT Figure 2. Relation between odorant concentration in diethyl phthalate and both arithmetic mean of perceived odor intensity (magnitude estimation) and arithmetic mean hedonic rating (•9 scale). The physical concentrations span a set of four-fold dilutions in the diluent. The magnitude estimates are shown in logarithmic values and the hedonic ratings are shown in linear values.

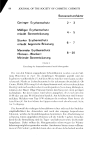
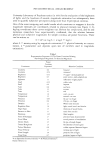
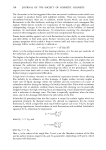
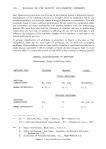
PSYCHOPHYSICAL MEASUREMENT 97 to illustrate ratios of perceptions and, finally, yields a continuous scale with no upper nor lower bounds. Degree of liking/disliking, using a "0" (dislike extremely) to "9" (like extremely) hedonic scale. (This latter scale represents a fixed-point category scale in contrast to magnitude estimation scales, which have no fixed upper or lower limits and are continuous rather than discrete.) Figure 2 shows the average ratings for the odorants. Table III provides the estimates of functions that fit the average ratings. Power functions were used to describe the magnitude estimation data, and logarithmic functions (where they could be fitted) were used to describe the hedonic, category rating data. The important things about the data shown in Figures 2a and 2b and Table III are: Odor intensity, whether of simple or of complex odorants can be evaluated by untrained panelists. In a relatively complex testing situation, in which the panelists are confronted with odorants of varying concentrations and qualities, the untrained panelists can adequately discriminate and scale differences of hedonics and intensity. Thus, experimentally, at least 30 different odorants can be evaluated under a regimen that permits about 1-2 rain rest between odorants. Relatively small-sized panels of individuals provided stable useable data and functions in this study. (Such small samples are common in psychophysical studies.) Table III Intensity And Hedonic Functions For Odorants LOG: ODOR INTENSITY = K, (Log Concentration a) q- K 2 (K• = Power function exponent) ODOR HEDONICS = K 3 (Log Concentration a) q- K 4 ODORANT (Number of panelists) INTENSITY HEDONICS K• K• R b K 3 K 4 R b Ethyl Vanillin 0.55 1.54 0.39/0.99 0.39 5.79 0.18/0.90 (N = 28) Heliotropin 0.44 1.13 0.37/0.97 -- -- -- (N = 30) Pine Oil 0.44 2.06 0.41/0.% -- -- -- (N = 42) Terpineol 0.8 2 2.02 0.56/0.% -- -- -- (N = •1) D Carvone 0.22 2.81 0.29/0.98 -- -- -- (N = 44) Indole 0.32 2.07 0.32/0.89 --0.49 2.23 --0.19/--0.91 (N = 44) Hydrocoumarin 0.06 1.95 0.10/0.85 -- -- -- (N = 38) Sage Oil 0.37 2.37 0.43/0.95 -- -- -- (N = 45) apercentage concentration in diethyl phthalate. bFirst R = Pearson correlation for unaveraged data. Second R = Pearson correlation for average data (across all individuals) R varies between q- 1 (perfect relation), 0 (no relation), and -- 1 (perfect inverse relation). -- Means that no simple linear function could be fitted.
Purchased for the exclusive use of nofirst nolast (unknown)
From: SCC Media Library & Resource Center (library.scconline.org)