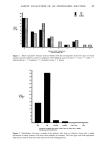
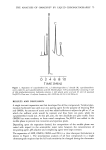
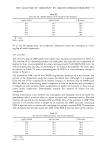
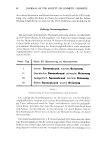
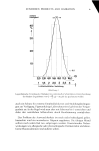
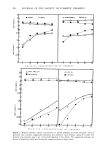
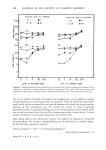
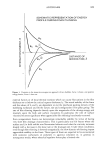
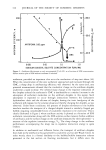
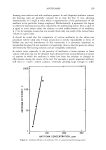
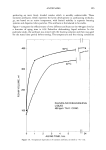
98 JOURNAL OF THE SOCIETY OF COSMETIC CHEMISTS Odor intensity conforms to a power function of concentration. The exponent of the power function (or the slope of the function in log-log coordinates) is almost always less than 1.0. Thus, the olfactory system governing smell perception compresses a larger range of physical variation into a smaller range of perceived odor intensity. Hedonic tone varies in different ways with the concentration of odorants (and thus with subjective odor intensity). Unpleasant odors (e.g., indole, sage oil) become increasingly unpleasant. Some pleasant odors exhibit either flat functions (in which the hedonic variations with concentration are random) or else exhibit a slightly increasing function which peaks at a middle concentration level. Above that peak the increase in concentration either diminishes liking or has no effect on liking. This last pattern is rare, however. These results confirm the general trend of findings that other investigators have reported over the past two decades, see Cain and Moskowitz (6) for a review of direct scaling. 4 16 CONCENTRATION OF ODORANT Figure 3. Relation between concentration of odorant (four-fold dilutions in air) and perceived odor intensity and liking (hedonics) of pulegone and limonene, respectively. All coordinates are log-log.

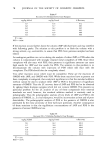
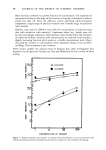
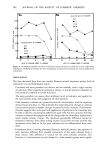
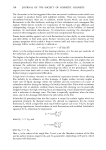
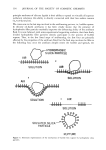
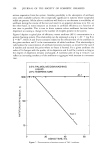
PSYCHOPHYSICAL MEASUREMENT 99 EXPERIMENTAL SERIES 2 In this experiment, panelists of similar age and background to those in Experimental Series 1 evaluated odor intensity, hedonics and quality by magnitude estimation (ratio scaling). The stimuli comprised two odorants, each presented at four concentration levels (20%, 5%, 1.25%, .3125% concentration in air). In addition, the odorants were paired so that each level of odorant A (Pulegone, a minty smell) was paired with every level of odorant B (Limonene, a lemon/lime or citrus smell). Altogether, this resulted in 24 stimuli. The stimuli in Experimental Series 2 were presented by means of a 24-channel, binary mixing olfactometer (7). The olfactometer passed a stream of deodorized, dry air over a sequence of four saturating tubes, which saturated the odor (approximately 95-98%), reduced saturation to 20% with odorless air, and then distributed the 20% saturated odorant at various flow rates to different channels. Three such streams were used: Stream A for odorant limonene (which was divided into 20 channels) Stream B for pulegone (also divided into 20 channels) and a stream of make-up, deodorized air. Every channel was presented at a final flow of 320 cc/min air, comprising X% of limonene, Y% of pulegone and (100-X-Y)% of odorless air. Figure 3 shows the dose-response function for odor intensity and for odor hedonics, for the pure, unmixed odorants. For hedonics, positive numbers reflect degrees of liking and negative numbers reflect degrees of disliking. Although negative numbers were permitted to show disliking (and 0 to show neutrality) the average liking ratings were all positive. Figure 4 shows the dose-response function for intensity and hedonics for the mixtures. Each odorant varies along a gradation of four levels (abscissa). The ordinate reflects the average magnitude estimates, and the parameter of each curve is the concentration of the second odorant added to the mixture. From Figure 3 it appears that unmixed odor intensity conforms to a power function. Furthermore, it is also apparent that over the 64/1 range of concentrations the exponent of the power function (or straight line in log-log coordinates) is less than 1.0, confirming the previous observation that odor intensity is a decelerating function of concentration. Finally, from the hedonic functions, it appears that these unmixed odorants increase in liking with concentration. The analysis of mixtures is slightly more difficult. These results in Figure 4 suggest that one odorant may suppress another. The exact degree of such suppression (or partial additivity, depending on one's point of view) has been modelled by vector addition of the form: Mixture Intensity 2 (AB) = A 2 + B 2 + 2AB cos 1) where A = Pulegone Sensory Intensity, B = Limonene Sensory Intensity. The foregoing 1 (8) states that the magnitude estimates of mixture intensity for two components (AB) can be predicted by squaring the magnitude estimate for one component (A2), adding it to the squared magnitude estimate of the second component (B2), and then adding their product--2AB cos (c•). Further, the values for c• should (a) be greater than 0 ø if partial additivity or partial suppression occurs (9) and (b) have empirically been found to range between 105 ø and 130 ø by several investigators (7, 8, 10).
Purchased for the exclusive use of nofirst nolast (unknown)
From: SCC Media Library & Resource Center (library.scconline.org)