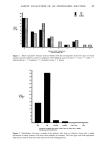
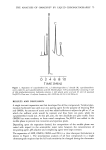
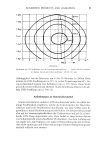
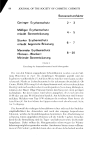
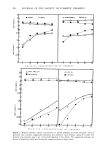
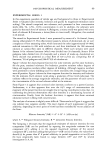
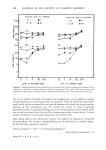
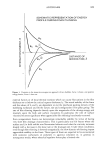
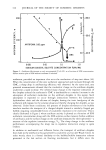
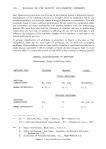
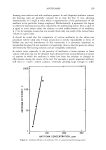
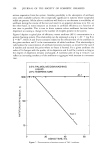
100 JOURNAL OF THE SOCIETY OF COSMETIC CHEMISTS lOO :50 ø • 20 5O 20 • lO • 5 i RELAT'IVE LEVEL OF LIMONENE RELATIVE LEVEL OF PULEGONE [] i6 ß 6q [] 16 ß 64 1 i i i i ,- i i i i 0 1 4 16 64 0 1 4 16 64 LEVEL OF PULEGONE ADDED LEVEL OF LIMONENE ADDED Figure 4. Relation between the perceived odor intensity and odor hedonics (magnitude estimates) of one odorant, as a function of given additional four-fold increments of the other. The added odorant was presented in vapor phase to a vapor stream containing the reference odor. The coordinates are log-log. The vector model of intensity summation (and suppression) can be applied to ratings of odor intensity and odor liking (which are positive). Table IV shows the values for o• itself, which can be estimated for every pair of odorants since both the subjective odor intensity of the components and the mixture are known by direct magnitude estimation scaling. As a general finding, the vector model applies at intermediate levels but not at the extreme levels of one of the components where it breaks down. At these extreme levels there is noticeable suppression (o• exceeds 130ø). Odor liking shifts as the odorants are mixed. The addition of pulegone to limonene increases liking. The change in liking/disliking can be predicted, to a modest degree, by the following regression equation: Liking of mixture = 6.68 q- 0.11 (liking of pulegone) q- 0.64 (Liking of Limonene) (2) where R 2 = 0.52, R •- 0.72.

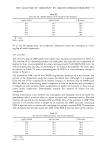
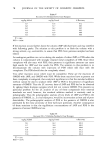
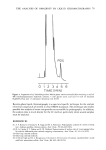
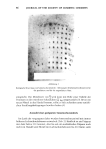
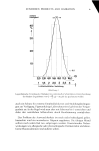
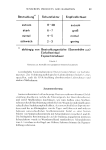
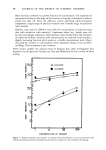
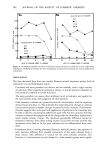
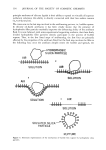
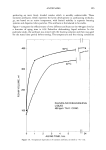
PSYCHOPttYSICAI, MEASUREMENT 101 Table IV Fit Of The Vector Additivity Model: (Mix)' = A 2 q- B 2 q- 2AB COS (o 0 (A,B = Magnitude estimate of pulegone and limonene odor intensities, in unmixed form. Mix = magnitude estimate of mixture.) Mixture Level Level Pulegone Limonene Intensity (o 0 For Mixture Evaluated On: Hedonics 1 1 1/t6.1 122.0 1 2 102.1 104.8 1 3 140.4 118.7 1 4 -- 28.6 2 1 65.0 108.7 2 2 85.8 128.8 2 3 93.5 122.3 2 4 81.3 103.5 3 1 108.1 112.7 3 2 116.5 109.3 3 3 124.7 127.4 3 4 110.6 101.8 4 1 -- 110.3 4 2 -- 108.1 4 3 139.9 122.7 4 4 112.0 113.0 -- Means that cos o• is outside the boundary q- 1 to -- 1. 107ø-130 ø is the traditional range of o•. If o• 130 ø, mixture is weaker than expected. If o• • 107 ø, mixture is stronger than expected. An alternative model, with interactions, is: Liking of mixture = 25.21 -- 2.15 (Liking of Pulegone) -+- 2..34 (Liking of Limonene) -- 0.11 (Liking of Pulegone X Liking of Limonene) (3) where R 2 = 0.66, R = 0.81. The vector model (Table IV) also provides an approach to evaluating mixtures. However, the applicability of the vector model is limited to those cases in which all ratings are either 0 or greater. The vector model does not apply when negative numbers are used. Thus, the applicability of the vector model here is only an accident, resulting from the fact that the mean liking ratings all exceeded 0. The predictors 2 and 3 above allow the experimenter to determine the estimated hedonic tone of the mixture by knowing the hedonic tones of the components. The equations pertain only to the mixtures of pulegone and limonene. Unfortunately there is only a small published literature against which to estirnate the generality of these hedonic mixture equations. Finally, Figure 5 shows some of the changes in quality that can be expected in mixtures. The addition of pulegone to limonene at increasing levels modifies the perceived magnitude of some odor qualities but not of others. As yet there is no way to know, other than by experience, what will be the sensory quality profile of a mixture as compared to the qualities of the unmixed components.
Purchased for the exclusive use of nofirst nolast (unknown)
From: SCC Media Library & Resource Center (library.scconline.org)