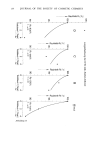
TRANSEPIDERMAL MOISTURE LOSS 185 The percentage of reduction in TFML can be determined at a variety of temperatures and relative humidities. RESULTS TFML CHARACTERISTICS OF THE SYNTHETIC SUBSTRATE Figure 2 shows the TFML rates for three samples of our polymeric substrate taken from beginning, middle and end of the roll. Two important factors should be noted here: 1) The shape of the humidity response curve of TFML is similar to that shown for human skin by Grice, et al. (7). This shape has also been observed by us in experiments with our in vivo apparatus. It is our belief that the shape of the curve is generated by water plasticization of the permeability constant (rising portion of the curve) and the effect of decreasing gradient with increased relative humidity (descending portion of the curve). The relatively large differences in the rates of the three samples from different portions of the film are most likely due to minor variations in film thickness and density 2) We have chosen a 2.5 ß ß 2.0 ß ß • '1.5 '• 1.0 • 0.5 0 0 10 20 30 40 50 % RELATIVE HUMIDITY Figure 4. Trans Film Moisture Loss rates (TFML) in mg/cm2/hr for a blank polymeric substrate (o), a Cream A coated polymeric substrate (,), and a USP Petrolatum coated polymeric substrate •!). Results are shown as a function of relative humidity.

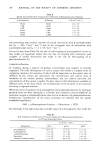
186 JOURNAL OF THE SOCIETY OF COSMETIC CHEMISTS film with a TFML of around 2.0 mg/cm2/hr. This was done primarily to achieve a high signal level to be able to detect subtle occlusion changes. Secondly, it was representa- tive of the rates of such skin areas as the back of the hand, forehead, etc., as reported by Baker and Kligman (12), and of extracted stratum corneum such as reported by Rieger and Deem (9). Figure 3 shows the effect of temperature on the trans film moisture loss rate TFML) at 0% RH and at 20% RH. This dependency follows the expected In TFML vs. øC which has been shown for human stratum corneum (1, 4, 7). As a matter of convenience, we have chosen to report our results at 30øC for the remainder of this paper. PERCENTAGE OF REDUCTION BY MATERIALS Figure 4 shows the TFML baseline rates for polymeric substrate alone, polymeric substrate with Cream A (a commercially available emollient cream) and polymeric substrate with USP Petrolatum. From these results, we have calculated the percentage of reductions in TFML attributable to Cream A and USP Petrolatum and these are displayed in Figure 5. lOO 9o :• 80 {• 70 0 60 5o 40 3o 2o 10 o- o o lO 20 30 40 50 % RELATIVE HUMIDITY Figure 5. The per cent reduction in the Trans Film Moisture Loss rate of the polymeric substrate for USP Petrotatum (&) and Cream A (©), as a function of relative humidity.
Purchased for the exclusive use of nofirst nolast (unknown)
From: SCC Media Library & Resource Center (library.scconline.org)