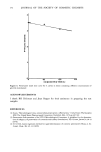
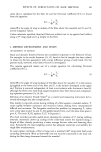
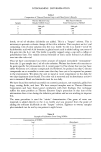
166 JOURNAL OF THE SOCIETY OF COSMETIC CHEMISTS plot of the log number of surviving organisms/g as a function of the time after inoculation into the product. It would be desirable to use the quantitative tates of death provided by D-values to determine the amount of preservative required to obtain a given rate of death for the challenge organisms in a cosmetic product. The objective of the work described in this report was to develop such a procedure. This was accomplished by use of the Preservative Death Time Curve--a plot of the D-values as a function of the concentrations of preservative used to obtain these D-values. EXPERIMENTAL TEST ORGANISMS The test organisms used in this study were taken from the Jergens culture collection and consisted of Staphylococcus aureus (FDA 209 strain) and Pseudomonas aeruginosa (PRD :tO strain). These organisms were grown and inoculated into test samples as described in a previous report (3). TEST SAMPLES The test samples used were proprietary formulations of lotions and shampoo. The lotion base contained propylparaben, and test samples were prepared by adding 0, 0.1 and 0.2% methylparaben or 0, 0.0:t, 0.1, and 0.2% glyceryl monolaurate. All percentages are % (wt/vol) unless otherwise stated. The shampoo was modified by adding 1% protein (N-Z -Amine Type AS, Kraft Inc., Memphis, Tenn.) and 0, :tOO, 200 and 300 ppm formaldehyde. TEST PROCEDURE Suspensions of the test organisms were prepared and introduced into the test samples, and aerobic plate counts were determined as described previously (3). PRESERVATIVE DEATH TIME CURVE The D-values for S. aureus and P. aeruginosa in the test samples were calculated (3). The preservative death time curve was calculated by plotting the D-values as a function of the concentration of the preservative used to obtain these D-values in the test sample. At least 3 data points (i.e., D-values and corresponding preservative concentrations) were used for each preservative death time curve. The slope and Y-intercept of this curve were obtained by linear regression, and the concentration of preservative required to give the desired D-value for the test organism in that product was determined by linear estimate. The correlation coefficient was calculated to

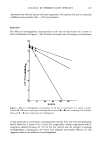
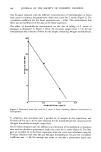
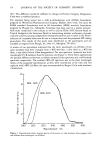
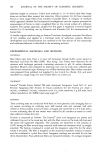
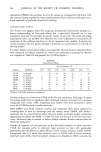
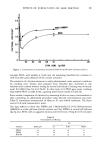
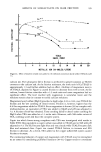
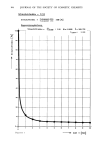
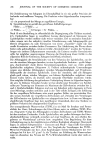
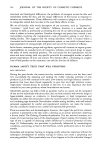
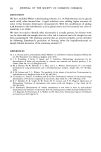
D-VALUE IN PRESERVATIVE EFFICACY 167 determine how well the data fit the linear regression. All analyses that had a correlation coefficient more positive than -0.97 were repeated. RESULTS The effect of methylparaben concentration on the rate of inactivation of S. aureus in lotion is illustrated in Figure 1. The D-values decreased with increasing concentrations O0 {i •O 1'5 • 2• HOURS Figure 1. Effect of methylparaben concentration on the rate of inactivation of S. aureus in lotion. Symbols: • lotion containing 0% methylparaben (control), • lotion containing 0.1% methylpa- raben, and ,•' =', lotion containing 0.2% methylparaben. of this preservative, and lotions containing 0% (control), 0.1% and 0.2% methylparaben had D-values for S. aureus of 19, 12 and 4 hr, respectively. Similar experiments with P. aeruginosa yielded D-values of 0.5 hr for the control and the samples containing methylparaben consequently, the lotion had adequate preservative efficacy for this organism without the addition of methylparaben.
Purchased for the exclusive use of nofirst nolast (unknown)
From: SCC Media Library & Resource Center (library.scconline.org)