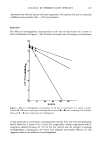
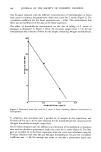
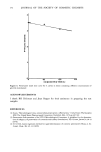
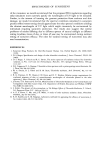
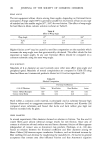
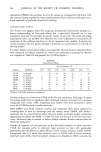
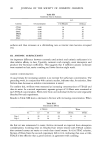
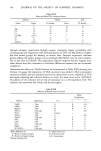
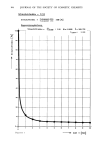
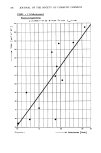
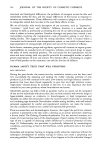
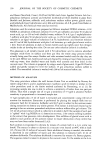
170 JOURNAL OF THE SOCIETY OF COSMETIC CHEMISTS 0 0 1•)0 200 3•0 4•0 CONCENTRATION (ppm) Figure 4. Preservative death time curve for S. aureus in shampoo containing different concentrations of formaldehyde. It is possible to set guidelines for accepting or rejecting a product based on the performance of its preservative system because the linear regression method provides a quantitative measure of the rate of die-off of the challenge organisms. It is believed that pathogens should be inactivated completely in 24 hr in multiple-use products intended for application in or around the eye and for baby products. Thus, a product should have a D-value of -4 hr for pathogens, so that 106 pathogens/g will be inactivated in 24 hr. Also, a product should have D-values of _28 hr for non- pathogenic bacteria, yeasts and molds, so that 106 organisms/g will be inactivated in 7 d(3). The preservative death time curve enables one to determine the amount of preservative required to obtain a given rate of death for a specific test organism in a cosmetic product. A minimum of three data points must be used in constructing this curve. Also, the desired D-value should be bracketed by D-values established using different concentrations of the preservative under study. The slope and Y-intercept of the preservative death time curve were determined by

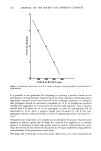
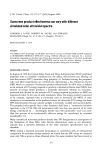
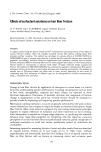
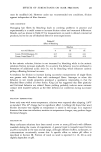
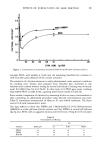
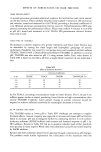
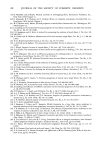
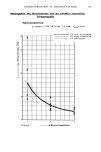
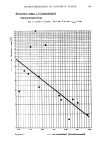
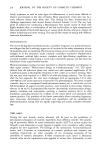
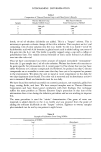
D-VALUE IN PRESERVATIVE EFFICACY 171 61 0 ' lO 5 HOURS Figure 5. Effect of glyceryl monolaurate concentration on the rate of inactivation of S. aureus in lotion. Symbols: • lotion containing 0% glyceryl monolaurate (control), • lotion containing 0.1% glyceryl monolaurate, and • lotion containing 0.2% g|yceryl monolaurate. linear regression. The correlation coefficients calculated for the studies described here ranged from -0.97 to -1.00. Thus, there was a very good fit of the data to the linear regressions. As was stated in an earlier report, $. aureus was used as the standard test organism in the preservative efficacy tests because this organism had greater resistance to the preservatives than other test bacteria in our culture collection (3). No attempts were made to calculate preservative death time curves for P. aeruginosa in these tests because the D-values obtained with the lowest concentrations of methylparaben, formaldehyde and glyceryl monolaurate were within the acceptance criteria (3). There was excellent agreement between predicted and actual preservative concentra- tions required to obtain a given D-value. For example, it was predicted that a D-value of 4 hr would be obtained by incorporating 0.2% methylparaben into lotion--this was found to be the case experimentally. These studies demonstrate the usefulness of D-value determinations and the preserva- tive death time curve in selecting the proper concentration of preservative to use in a cosmetic product.
Purchased for the exclusive use of nofirst nolast (unknown)
From: SCC Media Library & Resource Center (library.scconline.org)