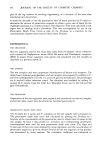
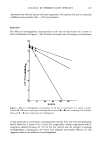
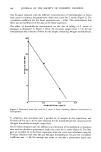
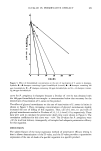
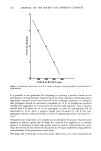
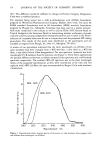
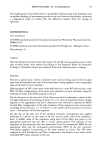
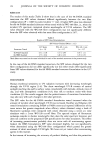
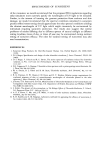
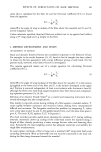
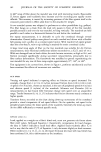
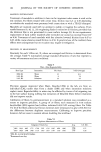
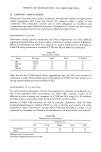
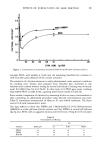
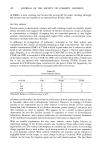
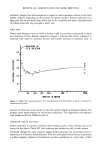
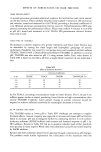
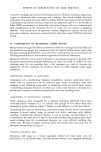
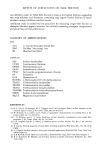
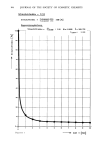
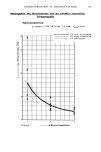
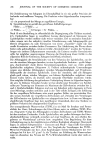
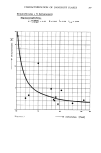
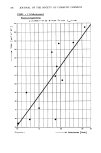
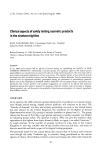
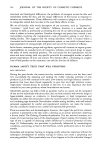
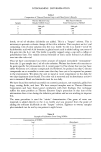
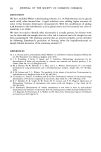
168 JOURNAL OF THE SOCIETY OF COSMETIC CHEMISTS The D-values obtained with the different concentrations of methylparaben in lotion were used to construct the preservative death time curve for S. aureus (Figure 2). The correlation coefficient for the linear regression was --0.996. This demonstrates that there was an excellent fit of the data to the linear regression. The effect of formaldehyde concentration on the rate of killing of S. aureus in shampoo is illustrated in Figure 3. Here, the D-values ranged from 7.7 hr for the formaldehyde-free control to 0.98 hr for the sample containing 300 ppm formaldehyde. 0 0.'1 0'.2 0:3 CONCENTRATION (%) Figure 2. Preservative death time curve for S. aureus in lotion containing different concentrations of methylparaben. P. aeruginosa was inoculated into a parallel set of samples in this experiment, and D-values of 4 hr and 0.6 hr were obtained for the formaldehyde-free control and the 100-ppm formaldehyde sample, respectively. The D-values obtained with the different concentrations of formaldehyde in shampoo were used to calculate a preservative death time curve for S. aureus (Figure 4). The data gave an excellent fit to the linear regression when the curve was calculated using the D-values obtained with 100, 200 and 300 ppm formaldehyde, because the correlation coefficient was -1.00. No attempt was made to calculate a preservative death time

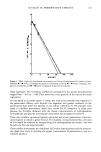
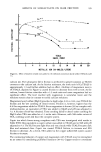
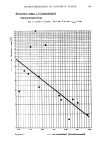
D-VALUE IN PRESERVATIVE EFFICACY 169 o o 5 lO 15 20 25 HOURS Figure 3. Effect of formaldehyde concentration on the rate of inactivation of S. aureus in shampoo. Symbols: • shampoo containing 0 ppm formaldehyde (control), • shampoo containing 100 ppm formaldehyde, ,•' •', shampoo containing 200 ppm formaldehyde, and © O shampoo contain- ing 300 ppm formaldehyde. curve for P. aeruginosa in shampoo because a D-value of 0.6 hr was obtained with the 100 ppm formaldehyde test sample--a concentration below that necessary for the desired rate of inactivation of S. aureus in this product. The effect of glyceryl monolaurate on the rate of inactivation of S. aureus in lotion is shown in Figure 5. Here, increasing concentrations of glyceryl monolaurate slightly increased the rate of killing of this organism. Thus, use of 0, 0.01, 0.1 and 0.2% of glyceryl monolaurate resulted in D-values of 3.5, 3.5, 3.4 and 3.1 hr, respectively. These data were used to calculate the preservative death time curve shown in Figure 6. The correlation coefficient for this curve was --0.97. The D-values for P. aeruginosa were 0.5 hr in all test lotions consequently, all samples had adequate preservative efficacy for this organism. DISCUSSION The salient feature of the linear regression method of preservative efficacy testing is that it allows determination of the D-value, and the D-value provides a quantitative expression of the rate of death of a specific organism in a specific product.
Purchased for the exclusive use of nofirst nolast (unknown)
From: SCC Media Library & Resource Center (library.scconline.org)