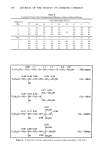
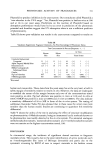
294 JOURNAL OF THE SOCIETY OF COSMETIC CHEMISTS One such equation is generated for each dependent variable e.g. one for sedimenta- tion rate, one for viscosity, one for resuspendability, etc., and the set of equations defines a response surface and, in fact, defines the system under study. Once the mathematical model has been generated, it can be treated in several ways to find the optimum formulation: Mathematical Methods: Such as the Lagrangian Method used by Fonner, Buck and Banker for a tablet formulation (8) and later by Buck, Peck, and Banker for a suspension formulation (9) Search Methods: Such as the system previously described, which is assisted by computer 00) or Graphical Methods: Used in all of the above, and the method of steepest descent was used mathematically by Dincer and Ozdur- mus for an enteric film coating Xl=X2=X3=X4=X5=O. GVEEGUMK (• z ss 4. z2 -b. 80 -b. 2' o: •8 o: so •: o• •: •( X(I} Figure 3. Computer generated plot of pH (dependent variable) as a function of suspending agent concentration (independent variable).

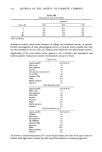
OPTIMIZATION TECHNIQUES 295 It should be emphasized that in these techniques we are not looking for the best of the experiments performed. We have now generated a set of continuous equations which can be evaluated to produce any combination of the independent variables. Once the predictor equation is available, one can begin to get a picture of the system by graphical representation. Figure 3 shows a computer drawn graph of pH as a function of Veegum level in the particular suspension under study. This type of curve represents only a partial description of the system since the independent variables not shown must be held constant at some level to obtain this curve they can be held constant at any level in the experimental range. Any property may be shown as a function of any independent variable in this manner. Xl=X2=X3=X•=X5=O. •VEEGUM• &KELTR•L / +NRTER xCITRIC RCIO Figure 4. Computer generated plot of Sedimentation Volume (dep. var.) as a function of each of the independent variables. Composite graphs (such as Figure 4 for sediment volume) can also be generated for all of the independent variables at once. This represents the superimposing of five of the previous graphs at once, and this is easily done by keeping the absissa in experimental (statistical) units, rather than physical units.
Purchased for the exclusive use of nofirst nolast (unknown)
From: SCC Media Library & Resource Center (library.scconline.org)